Project Management Part 3: Statistics, Risks and Recommendations
- Джимшер Челидзе
- May 31, 2024
- 27 min read
Updated: Jul 12, 2024
What do you think is the difference between those new to project management and experienced managers?
In their accents.
Beginners focus on compliance with formal instruments, while experienced managers focus on risks: they try to identify them as early as possible and either prevent negative consequences or minimize the cost of elimination. As we wrote in the last article , our focus is on managing communications and early identification of risks from human experts in their field.
Do you know why experienced managers look so closely at risks?
To answer this question, you need to study statistics and understand how often changes or implemented projects are completed on time, over budget or did not achieve the set success criteria, what is the average deviation during project implementation?
Well, then you need to figure out what tools are there to identify risks, how to minimize these risks, including using digital tools?
Also, as a preface, we add that most of the figures below are relevant for IT and digital projects, but they are more than suitable for projects in “classical production”; there is no fundamental difference.
Content
Introduction
So, first, let's figure out how deep the problem is? What proportion of projects have problems or fail?
First, we suggest recalling our article and what the “project triangle” is based on

If we turn to Standish Group research, we find that on average 30% of projects are successful , and 70% of projects are problematic or failed: they exceed deadlines, budgets, do not meet success criteria, or are completely closed before completion.
Thus, according to her research in 1994 ( link 1 and link 2 ), the share of successful projects was only 16.2%, and in 2018 there were about 29%. At the same time, since about 2000, the share of successful projects has stopped increasing, and after 2015, on the contrary, a downward trend appears.
We invite you to familiarize yourself with several figures from studies and presentations

Also some statistics from the industry report

At the same time, the most “problematic” projects are the most expensive and largest (if we remove product estimates from attention)

And this is logical, because if we turn to the same Kinevin model , then the larger the project, the more unobvious the connections in it, there are simply more “bottlenecks” and it is much more difficult to take into account all the factors, that is, the larger the project, the more flexible you need to be and work more on risk issues. And this is confirmed by Standish Group statistics .
The most attentive readers here may ask the question: “Hey, this is a contradiction with the study on product management statistics . After all, product managers often use Agile practices. And as a result, product initiatives fail more often, but here it’s the other way around.”
And he will be absolutely right in his objection.
But let's remember how projects differ from products? We talked about this in the article about product management . The difference is briefly demonstrated below.


As a result, product managers work with greater uncertainty and over a larger horizon. And on the one hand, projects within a product initiative can be successful, but due to global errors the product will fail or be problematic: incorrect functional priorities, errors with marketing and product positioning, in general there are many reasons.
This is also confirmed by the Standish Group statistics . If we are talking about IT projects and software development, then in the end, of the entire list of built-in functions, only 20% are in demand and are used often, 30% - rarely, and almost 50% - never.

This gives rise to even more sad statistics about the success of products

And if you dig into the statistics of startups and young companies, the statistics are even sadder - 90% close within 3 years, and about 99% within 5 years. This comes with additional problems of working with investors, forming a team, and building systematic work. There is also an infographic below about what a systems approach is in our understanding.

So why, in project management terms, are Agile projects more successful? There are many reasons, but not least because of the approach to planning. In flexible methodologies, we start from available resources - time and budget. We discussed this issue in our article earlier .

Now let’s look at the analysis: what are the consequences of all these problems? On average, according to research by the same Standish Group , IT projects have the following deviations:
exceed the initial budget by an average of 50-60%
the average time exceedance in problematic projects is 80-85% of the plan

All these figures agree with our observations. Well, regarding when changes need to be made and why experienced managers try to identify risks as early as possible - the answer to the visualizations is below

Now it’s clear why experienced project managers focus on the initiation and planning stages and can devote up to 30-40% of the project’s time to these stages.
And a little more about the project success factors

Now just think how many of these criteria can be covered by working with risks, be it at the planning or implementation stage, conducting reviews based on the results of the project and learning from your own mistakes.
At the same time, as a recent study “Project Management in Russia 2022” conducted by the head of the SberMarket project office Dmitry Ireshev showed, project managers everywhere use planning tools and all kinds of task trackers. At the same time, from personal observations we can conclude that the culture of continuous improvement of planning processes is not yet widespread. It turns out that project managers love to plan, but they do not learn from their mistakes, structure the experience gained, and improve the quality of planning.

The classification below is very conditional, but nevertheless allows you to understand “where” to look when you are engaged in the most difficult task - identifying risks.
Global or systemic risks:
Political - changes in the political situation in the country and the world.
Natural risks . These include environmental disasters or natural disasters.
Legal - this includes both the imperfection of existing laws and the risk of new ones that could create additional problems for business.
Economic - changes in the tax system, sanctions against the state, losses due to instability of exchange rates, etc.
Private or local risks:
Production - production and management errors and restrictions, including failure to fulfill the sales plan, reduction in production volumes.
Financial - loss of profit from the project, illiquidity of products
Market - instability of the market situation, for example demand, company pricing policy, competition
A slightly more detailed classification is presented below.

What are the main documents that you can rely on when working with risks?
The key document is GOST R ISO 31000-2010
Here are the main diagrams from it

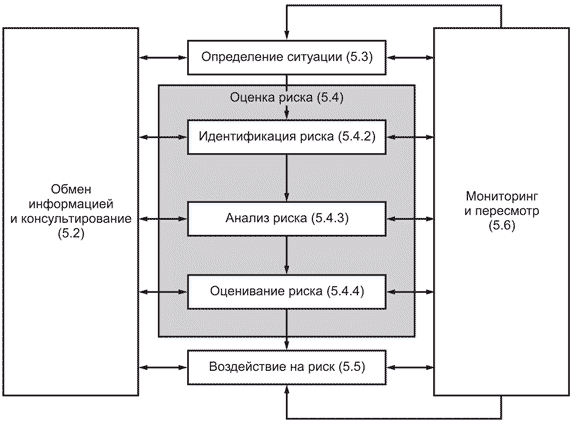
To simplify it completely, the mechanism for working with risks within a project is shown in the diagram below.

Main types of risks by area of project management

Checklist of common project risks:
Project Schedule
Budget/financing
Personnel issues (absence of a manager and insufficient number of employees in the group)
Quality (non-compliance with quality standards)
Mutual agreement of key stakeholders (conflicts)
Project Scope Changes
Project plans (their consistency and elaboration)
Project management methodology
Business risk
Management risk (reorganization leading to a change in the composition of the project team)
Risks from the supplier (delay or cancellation of deliveries)
Legal issues - increased cost, negative image
Political risks - negative image
Environmental risk
Weather and natural disasters
Technological risks (necessary components are not available).
Complexity of the project and personnel qualifications (lack of competencies of the project team and manager)
As you probably already guessed, the most difficult thing in this area is identifying the list of risks and assessing them.
We are immersed in the topic, we understand the consequences and the general algorithm, but what could be the strategy for dealing with risks?
Exception
The elimination strategy involves completely eliminating risk from the project. That is, it is necessary at the “top” level to come up with an action that will eliminate the very possibility of the risk occurring. This strategy is very complex and expensive to implement, and sometimes impossible, as it can force you to abandon part of key work or the entire project.
For example, you work in the field of logistics and you need to eliminate possible cargo downtime. As a result, eliminating this risk can be so expensive that cargo delivery loses all meaning.
The same goes for software development and implementation. You can eliminate the risks of changing the Customer's requests by strictly fixing the requirements in the contract. But does this guarantee the success of the project as a whole, and most importantly, will the client agree to such conditions?
Minimization
This is the most common strategy. Its task is to work out the risk in advance and minimize the likelihood of its occurrence and/or the severity of the consequences.
Let's look again at the example of logistics. Is it possible to reduce the risk of a car breakdown on the road to zero? Of course not, but what can be done to minimize this likelihood? For example, organize timely maintenance, issue fuel cards with network gas stations so that the driver does not fill in low-quality fuel, focusing on a low price.
And the second example is software development again?
Is it possible to completely eliminate the situation when the client changes his wishes? Also no. But what if we conduct an examination at an early stage, tell the client how we see the solution to the problem taking into account our experience, describe possible alternatives and, together with the Client, choose the best option before starting work. As a result, we did not completely eliminate the risk, but we minimized the likelihood of its occurrence and possible consequences, because now you are unlikely to have to redo everything, but only adjust some details.
Yes, this is a difficult option, not all Clients are ready to think and listen, but entering into projects that are dangerous in advance may turn out to be too risky. The “sell at any cost” strategy is always losing in the end.
Adoption
Everything is simple here - until the risk occurs, you are supposed to “do nothing.” However, doing nothing at all is not risk management. There are 2 options here - active and passive acceptance.
Active – a reserve of time and money is formed to eliminate the consequences of risk materialization. So, the most common rule for more or less clear projects is to set aside a reserve of 30-35% for various force majeure and unforeseen expenses. But there are 2 restrictions:
a manager’s experience is still needed so that he can correctly assess the timing and cost, the number of missed conditions and their potential impact in advance;
it is necessary to negotiate with the Client, because the more stock you have, the better it is for you, but worse for him.
Passive - having a plan B (remediation of the consequences of the problem) in case the risk materializes, in which the project management and its team will solve problems due to this risk on their own as they arise.
This is a good strategy to use for very small risks that will not have a large impact on the project if they occur. At the same time, developing an alternative risk management strategy and developing additional ones can be prohibitively long and expensive, which can jeopardize the entire project.
Delegation
This strategy shifts the consequences of the risk and the responsibility for responding to a third party, without eliminating the risk itself. This strategy almost always involves financial costs to transfer and receive financial compensation if the risk materializes.
A typical example is insurance. We transfer our risks to the insurance company. Which, if there is a risk, for example, damage to the cargo during a storm, will pay you all penalties. But for all this she takes a bonus.
Well, or, if using software development as an example, you can enter into an agreement with a consulting agency so that they initially conduct a survey of the client and prepare all the requirements. And if the requirements change during the process, they will pay for all the overtime of your people and all the client’s legal claims. But this is from the realm of fantasy; it is unlikely that anyone will agree to such conditions, or the price of a contract with consultants will become such that your client will abandon the project.

Risks can be identified or identified through several key approaches:
retrospective analysis
analysis of the current project
analysis of possible events
Next, we will take a closer look at the main tools within this classification. If you are interested in diving deeper, there will be useful links to detailed articles
Here you can analyze the company’s past projects, well, if you have such an archive, where there are plans and a history of implementation, and, if you’re lucky, a retrospective of projects, with a history of risks that occurred and measures taken.
And if systematic work is being carried out (although we have practically never seen this), the company may have risk checklists.
Well, the final thing in this block is an analysis of best practices. If your project is not confusing, with connections that are not obvious, then you can study the best practices for implementing similar projects or use checklists
Here we study input information about the current project and the quality of project documentation:
how well the technical specifications and success criteria, the project product, and boundaries have been developed. Do these attributes have measurable indicators;
have the assumptions been worked out, has the technical feasibility of implementing the project and the need for modifications to the standard solution been assessed, does the project team have all the necessary specific/technical competencies;
Is there a map of stakeholders, is their influence assessed and a plan for working with them?
is there first-party support?
How well developed are the implementation plans and their consistency? Has the need for external suppliers been determined and is there any experience working with them?
If you look at IT projects, it is useful to pay attention to lean manufacturing, understanding the mechanisms of motivation and the causes of resistance, the 7 causes of most problems in digital projects.
Lean manufacturing
Understanding what losses occur in lean manufacturing allows you to identify risks:
related to the project's product requirements;
related to the internal organization;
related to the operation of IT systems (for example, speed or reliability, confusing interface, etc.)
Read more about lean manufacturing at the link.
Motivation and resistance to change
Projects are almost always associated with changes. The natural reaction of people is resistance and aggression. Understanding these mechanisms will also make it possible to identify risks and plan measures to eliminate or minimize them.
7 reasons for most problems in digitalization
There are several common causes in all IT projects that lead to most problems.
There is no global understanding of the essence, goals and technologies of digitalization and digital transformation
Lack of necessary soft and hard IT competencies
Lack of competence in project, product, change management, and in dealing with staff resistance at the medium and technical management levels
Inconvenience of IT systems, high labor costs for integration
into a single IP and maintenance
Low culture of working with data and processes
Lack of basic digital literacy among staff and virtualization of digital skills
Company culture, including expectations that someone will solve all problems
For more information, follow the link.
In general, the analysis of the current project is an analysis of whether everything has been done that should be worked out at the stages of initiation and planning.
This is the most complex area where complex mathematical and expert approaches are used: SWOT, brainstorming, scenario method, interviews, Ishikawa and influence diagrams, fault trees and hint lists (PESTLE, SPECTRUM, TECOP), as well as all kinds of modeling methods.
SWOT analysis is a strategic planning method for assessing internal and external factors that influence the development of a company. SWOT analysis is needed to assess the strengths and weaknesses of a company and determine development prospects and external threats.
S – Strengths (strengths),
W - Weaknesses (weaknesses),
O - Opportunities (opportunities),
T - Threats.

pros
versatility
applicable in a wide variety of areas of economics and management. It can be adapted to an object of study at any level (product, enterprise, region, country), and can be used for operational, tactical, and strategic planning.
simplicity and accessibility
There is no need for complex calculations or expensive marketing procedures. A SWOT analysis can be carried out by anyone who has information about the properties of the product and the market situation.
flexibility of working with data
Free choice of analyzed elements depending on the goals set (for example, you can analyze the city only from the point of view of tourism or only from the point of view of transport, etc.).
Flaws
results here and now
SWOT analysis reflects the current situation in the market and within the company and does not take into account expected changes. In other words, with the emergence of new factors or changes, the analysis will need to be carried out again.
subjectivity
Much depends on who conducts the analysis, his competencies, awareness and expertise in the industry, personal assessment and preferences
bias
there is no assessment of the main and secondary factors and their relationships
There are no quantitative estimates.
Useful materials:
The method is used to quickly solve problems and is based on stimulating the creative activity of people taking part in it and offering the maximum number of possible solutions. After all the options are announced, those that are most suitable are selected. Typically, brainstorming consists of 3 mandatory stages:
Formulation of the problem
Generation of ideas
Selection, systematization and evaluation of ideas
As a rule, 2 groups are created for brainstorming: the first includes idea generators who propose solutions, the second includes those who process the proposed solutions.
Key rules for brainstorming
Preliminary preparation
Many participants
Clarification of the task
Writing down all the ideas
No criticism
Maximum idea generation
Attracting other people
Modification of ideas
Visual display
A negative result is also useful
This section also includes lateral thinking approaches from product management.
Useful links:
A subtype of brainstorming in which participants generate ideas anonymously and in writing. The goal is greater participation of team members in idea generation.
Approximate Algorithm
The mediator (project manager) asks those present to write down on a sticky note only one, the most dangerous risk.
The facilitator then collects the notes and pins them on the board.
He then asks participants to write down the second most important or dangerous risk.
This continues until the group has exhausted all possible ideas.
Next comes the assessment and prioritization stage:
After identifying all risks and posting notes on the board, participants should rank them in order of priority. First they do this in writing: everyone makes their own list and passes it on to the mediator.
After reviewing all submitted responses, the mediator compiles a general list of priorities in accordance with the majority opinion. At this stage, he can turn to the group for clarification and comments. The result of this work is a complete list of risks, arranged in order of their significance or degree of impact on the project.
Key rules:
One note contains one risk.
Notes placed on the board should not duplicate each other.
Participants cannot criticize or judge risk options proposed by others. The group must be fairly compact and easy to manage, otherwise the process may take a long time.
pros
Low time investment, usually no more than 2 hours
Independence from authorities
A large number of ideas
Minuses
Decision-making on urgent issues is excluded
Using this method requires very qualified official guidance.
Useful links:
Allows you to assess the most likely course of events, as well as the most likely consequences of decisions made.
Based on the developed scenarios, it becomes possible, at a certain level of reliability, to determine possible options for events and developments of the situation, to determine the relationship between various factors.
As a rule, 3 scenarios are prepared
optimistic;
pessimistic;
expected, most likely.
The most popular implementation methods:
obtaining a consensus opinion;
iterative procedure of independent scenarios;
use of interaction matrices.
Advantages of the method
the ability to identify in advance decisions that are ineffective in terms of consequences;
development of several predictive options for the development of the situation and predict the behavior of the object in each of them.
The downside is the complexity of obtaining a large number of estimates and processing them correctly.
Useful links:
A set of question-and-answer sessions conducted with key stakeholders, team members, and other employees associated with the project or experience with similar projects.
They can name potential risks based on their past experiences.
Participants can be asked questions about past projects and situations that may arise in the future, provide a description of work, a matrix of distribution of responsibilities, a list of tasks, a list of restrictions, that is, all documents that can help them identify potential risks.
Pros:
the ability to identify hidden and unobvious risks through clarifying questions
It is possible to find non-obvious solutions and solutions to overcome
increasing the involvement of stakeholders in the project implementation process
the interaction process allows you to check the correct understanding of all questions by the respondent.
Minuses
complexity of data collection and processing
high cost and demanding competencies of the interviewer and assistants
complexity and labor intensity of checking the quality of interviewers’ work.
Useful links:
A tool for a systematic approach to identifying the actual causes of problems and risks.
Working with the Ishikawa diagram is carried out in several stages:
Identification and collection of all factors and causes that in any way influence the result/problem under study.
Grouping of factors into semantic and cause-and-effect blocks.
Ranking of these factors within each block.
Analysis of the resulting picture.
“Releasing” factors that we cannot influence.
Ignoring minor and unimportant factors.
To more effectively identify and add possible causes to the main ones, as well as to more specifically detail the possible root causes of the branches of the “main bone,” the brainstorming method is traditionally used.

Example of a diagram within project management

pros
convenient visualization of cause-and-effect relationships for staff
the ability to analyze a chain of interconnected causes to eliminate root causes and problems
no highly qualified employees are required, and there is no need for lengthy training
Minuses
there is no clear structure and hierarchy between blocks, no ranking of blocks, which makes it difficult to analyze cause-and-effect relationships
it is possible for one reason to appear in several blocks
it is difficult to eliminate errors in drawing up a diagram, because each employee sets out his own subjective vision of the problem
Useful links:
A method of forward and downward logical modeling of both success and failure. It works by simulating events through one trigger.
Starting with the triggering event, researchers are constantly looking for an answer to the question “What would happen if...”. Based on the answers received, the analyst builds a tree of possible outputs. Therefore, it is extremely important to list all possible triggering events.

pros
Allows you to evaluate multiple coexisting variations
Works simultaneously in case of failure and success
No need to foresee final events
Paths in the system that lead to failure can be identified and tracked to show ineffective countermeasures
Can be performed at different levels of detail
Visual cause and effect
Relatively easy to learn and apply
Models complex systems in an understandable way
Allows probability estimation
Minuses
Each key event requires a separate diagram - high labor costs for complex analysis
The initial challenge must be identified and all paths worked out by the analyst - subjectivity and reference to the human factor
The level of loss for each path cannot be discerned without further analysis
Difficult to determine the likelihood of success or failure
It is possible to miss factors that may seem unimportant at first glance.
Partial successes/failures are indistinguishable
useful links
The fault tree (incidents, consequences, undesirable events) underlies the logical-probabilistic model of cause-and-effect relationships between system failures and failures of its elements and other events (impacts).
Fault tree analysis can be used to:
understanding the logic leading to an undesirable phenomenon or condition;
creating lists of critical events;
resource minimization and optimization;
identifying and eliminating the causes of the upper event, helping to create diagnostic guidelines.
Example visualization below

pros
focus on finding potential problems and convenient visualization;
the method allows specialists to focus on individual specific events or bottlenecks one by one;
provides a deep understanding of the behavior of the system and insight into the process of its operation;
are a means of communication between specialists, since they are presented in a clear, visual form;
helps deductively identify failures;
facilitates reliability analysis of complex systems.
Flaws
implementation of the method requires a significant investment of money and time: increasing the detail of the system under consideration leads to a geometric increase in the number of influencing events;
A fault tree is a Boolean logic diagram that shows only two states: operational and not;
difficulties in analyzing systemic or “multiple” bottlenecks
A fault tree describes a system at a specific point in time.
Useful links:
All the approaches below are a kind of checklists, or as they say now - frameworks that suggest considering risks according to a certain list.
PESTEL analysis or PESTLE analysis (formerly known as PEST analysis) is an approach to assessing factors or risks in the external environment that we cannot directly influence
The approach involves analyzing the following factors:
political
economic
sociocultural
technological
environmental
legislative and legal.
Here are the factors to evaluate:
sociocultural
political
economic
competitive
technological
legislative and legal
uncertainty
market
Well, the final list focuses on:
technical factors
environmental
commercial
operating rooms
political
The idea is to use a series of sequential actions—surveys, interviews, brainstorming—to achieve maximum consensus in determining the right solution. Analysis using the Delphi method is carried out in several stages, the results are processed by statistical methods.
The Delphi method involves summarizing all individual expert assessments regarding one situation in order to obtain the most reliable and reliable overall opinion.
That is, this method involves identifying risks using the tools above, and then assessing them.
Stages of the Delphi method
preliminary stage
main stage
analytical stage.
Preliminary stage
Selection of an expert group. The recommended number of experts is 20.
Main stage
Presentation of the problem to experts
Decomposition of the problem by experts into smaller ones
Analysts select the most common questions and create a general questionnaire
The resulting questionnaire is again presented to the experts and the need to adjust the questionnaire is assessed
Analysts are compiling another questionnaire
The new questionnaire is again provided to the experts. Now they need to propose their own ways to solve the problem and explore alternative positions of other experts. Here the effectiveness, availability of resources, and relevance of solution methods are assessed.
Analysts identify the main opinions of experts and try to bring them together. If someone's opinions go against the majority opinion, these opinions are voiced to experts. As a result, experts can change their positions, after which this step is repeated again.
The steps are repeated over and over again until the experts reach a consensus and a consensus is established. And analysts' examination of differences in opinion among members of an expert group can point to previously unnoticed subtleties of the problem. In the end, an overall assessment is made and practical recommendations are made to solve the problem.
Analytical stage
The consistency of expert opinions is checked, the findings are analyzed and final recommendations are developed.
Disadvantages of the method
Event organizers have excessive powers compared to experts
The collective opinion is not correct in all cases
Analysts discard creative solutions that have the fewest supporters, but these solutions may be the most effective.
Operational analysis is not possible because the last step requires a lot of time: each analysis step can take at least 24 hours
Experts tend to show conformism, feeling the desire and striving to join the opinion of the majority
Organizers have the ability to manipulate the expert group
useful links
This approach includes the following methods:
Expected value
Variance and standard deviation
Market risk assessment (Value at Risk)
Semi-dispersion
We tried to figure out how to describe all this in an accessible and understandable way, but alas, we have not yet found suitable ways.
If you are interested in diving into this topic, then use the links below; we won’t go into it here, because the absolute majority will not use them in life.
Useful links:
And so, we identified all the risks, assessed the likelihood of their occurrence, and the severity of the consequences. What to do with these?
It is necessary to structure this information and develop a strategy in relation to each of the risks and develop an action plan.
There is a tool for this called the risk matrix. There is a simplified version - 3x3, it is below

There is also a larger version - 5x5

Accordingly, the following algorithm is born from this:
for the red zone, strategies of exclusion (up to abandonment of the project) or delegation (insurance) are required. As a last resort, minimization. This requires constant monitoring and frequent reviews.
for yellow and orange zones - minimization or delegation (insurance). It is necessary to either track or configure early trigger points
for a green zone, the adoption strategy is quite acceptable, and the response
A schematic way of describing and analyzing the development path of a dangerous event from causes to consequences. This method combines the investigation of the causes of an event using a fault tree and the analysis of consequences using an event tree.


Construction algorithm
Risk name in the center
On the left - the reasons for the risk
On the right are possible consequences.
We critically evaluate the result and develop control tools: on the left to identify potential risks at an early stage, on the right to minimize the damage from the risk
Useful links:
Monte Carlo Simulation
The Monte Carlo method refers to methods for modeling various phenomena, events, parameters or processes, both favorable and unfavorable, in order to determine the probability of their occurrence. To do this, a certain number of random variables that meet established criteria are generated, and then, based on them, the approximate value of the desired value is calculated


Useful links:
Bayesian statistical methods use Bayes' theorem to calculate and update probabilities after receiving new data, that is, Bayes' theorem describes the conditional probability of an event occurring


A mathematical tool for a systematic approach to complex decision-making problems.
The MAI does not prescribe any “correct” decision to the decision maker ( DM ), but allows him to interactively find an alternative that best matches his understanding of the essence of the problem and the requirements for its solution.
Analysis of the decision-making problem in the MAI begins with the construction of a hierarchical structure, which includes the goal, criteria, alternatives and other considered factors influencing the choice. This structure reflects the decision maker's understanding of the problem


Stages
1. Identification of the problem. Determining the goal.
2. Identification of main criteria and alternatives.
3. Building a hierarchy: a tree from the goal through criteria to alternatives.
4. Construction of a matrix of pairwise comparisons of criteria by goal and alternatives by criteria.
5. Application of the technique for analyzing the resulting matrices.
6. Determination of weights of alternatives according to the hierarchy system
Useful links:
And so, you and I plunged into working with risks. Agree, it is a large and complex direction, with a large set of tools.
What is the common problem in the entire risk management area?
High complexity of mathematical methods
They are not suitable for mass use. The average employee will not be able to master them, and even if he can, it will be almost impossible to explain and convey to senior management
High labor costs
This applies to both expert and mathematical methods. Add to this a low awareness of the problems and understanding of project management statistics, and in the end we get that no one wants to do this and waste resources
Subjectivity
Many methods are extremely dependent on the personality of the expert and/or analyst. But what does the human factor lead to and what are the typical pitfalls? Answers below

Typical psychological errors when assessing risks:
“representativeness” effect – overestimation of the reliability of small samples, non-random nature of the sample
the “visibility” effect – overestimation of “understandable”, memorable risks
“egocentrism” effect – focusing on one’s own experience rather than data
the effect of “conservatism” - the rigidity of the prevailing opinion about any events
“edge” effect – underestimation of highly probable events and overestimation of low-probability ones (in this case, too low a probability may not be perceived at all)
“Monte Carlo” effect - the desire to establish a connection between two successive events, including this can be called apophenia
conformism is following the rules, guidelines and norms of a group, under the influence of real or imagined pressure
The Dunning - Kruger effect is a cognitive distortion in which people with a low level of qualifications make erroneous conclusions, make poor decisions, and at the same time are unable to recognize their mistakes due to their low level of qualifications.
Now let's see what we see in life? Here we present the results of a survey from the Telegram channel of Mikhail Sofonov.

And let us once again recall the results of Dmitry Ireshev’s research
In the end, how do you think we usually work with risks? Is there a culture of working with risks at all?
The short answer is no. We have almost never seen high-quality work in this direction: it either does not exist, or it is formal.
And yes, it cannot be unequivocally stated that this is the only reason why project management has such depressing statistics, but how many problems could have been avoided if:
at the start of the project, in the initiation and planning stages, the main risks and strategies for working with them were worked out
during the implementation of projects, at least a diary was kept, with records of all events and triggered risks
Based on the results of the project, a review and analysis would be carried out, and the lessons learned would be entered into the knowledge base.
What do we end up with?
First, there are global initiatives like ESG. You can read more about this direction in our article .
Secondly, digital tools are starting to appear. We are now, in 2022, working on our digital advisor for project management. This is not a tracker like Jira or a project management system like Advanta. This is precisely a system for supporting and making decisions, creating a culture of project management without being tied to specific software.
Our philosophy is to evaluate the project, culture, leader and prepare a specific hybrid with recommendations and support from the leader: what to do and when. In addition to this, it is necessary to conduct training in game and scenario form.

How is the issue of project management generally resolved? If we are talking about large companies and corporations, then:

If we are talking about startups and “young” organizations that want to be Agile

Read more about the solution in the presentations below.
At the same time, digital solutions for risk assessment already exist. For example, RISKGAP . Moreover, this is a Russian solution, and we plan to integrate this system into our solution.
What is this decision about? Below is a small gallery from the official presentation of the system


What is the advantage of digital systems?
the ability to implement complex algorithms that the average employee will not be able to use
the ability to influence the entire system/culture in the company
automated accounting of experience
objectivity and impartiality
the ability to track trends and systematize “external” experience
What is the key disadvantage?
big data is needed for high-quality training of systems - high complexity
mistrust of users/employees
Project management itself is a complex area of management, which is still very poorly mastered. And mass implementation is very complicated. And working with risks is generally difficult for the average employee or small and medium-sized business; the methods are too complex and labor intensive. At the same time, large businesses that have resources cannot build high-quality work both in the field of project management and in the field of working with risks. Large businesses tend to implement large-scale projects, and at the same time quite ordinary and, so to speak, normal people work there. As a result, project management has sad statistics with high losses for companies.
Our opinion is that everyone will gradually come to implement small and simple projects using modern digital advisors.
Now the key task is to carry out the main actions at each stage of the project in a disciplined manner.
And so, a checklist of project management tasks
For the initiation stage
Determining project goals (commercial, marketing, technical, production, operational) and its boundaries, including deadlines
Setting success criteria and targets, evaluating effects
Assessment of technical and resource (money, technology, competence) feasibility of implementation
Identification of key stakeholders, their interest and attitude towards the project, degree of influence
Identification of project limitations/key risks, including probability of occurrence and severity of consequences
Assessment of the necessary competencies for project implementation and the composition of the project team, organizational structure (powers of the project manager and his line of responsibility, involvement of project team members)
Assessing the need for external suppliers
Evaluate alternative ways to achieve project goals
The need to implement changes in business processes and the work of other employees and the possibility of these changes have been identified
Preparation of the project charter
Final assessment of the feasibility and feasibility (adequacy of resources) of the project implementation, making a decision to launch the project
For the planning stage
Preparation of technical specifications that describe the project product and key requirements for it and its quality
Determining the approach to project implementation and product delivery
Determining and recording the need for improvements to the standard solution (for project sales)
Determining the structure of work (what work is needed and in what sequence, how they are interconnected)
Preparation of a calendar and network plan (work is divided by time)
Planning financial and resource support, identifying the sources of these resources, preparing a financial plan (if necessary)
Determining risk response strategy and tactics
Determining the areas of responsibility of project team members
Preparation of a communication plan (who, with whom, when, about what, in what format and form, through what communication channel they interact)
Preparing a change implementation plan
Preparing a plan for working with external suppliers
For the implementation stage
Monitoring the implementation of the project plan and deviations in terms of timing, volume/content, budget
Quality control of work performance and compliance with established requirements for the project product
Managing stakeholder expectations and mid-term project evaluations
Execution of the change implementation plan
Keeping a communication diary
Working with risks and recording the occurrence of unplanned risks. Taking corrective action before negative consequences occur
For the completion stage
Documentation of work performed, including certificates of completed work
Project evaluation by team members, project manager, client/sponsor, end user of the product and supervisor
Conducting a project retrospective: what was implemented well, what could be improved in the organization of the project, what risks and what additionally needs to be taken into account at the initiation and planning stages next time
useful links
***
We develop our own digital solution for your projects. You can get acquainted with it at the link: