Product management. Part 2
- Джимшер Челидзе
- Jul 9, 2024
- 35 min read
This is the 2nd post about product management. Part 1 is available at this link
Content:
RICE
RICE is a method for prioritizing ideas, features, and product capabilities. The acronym includes 4 factors that can be used to evaluate prioritization
Reach is coverage
Impact - influence
Confidence - Confidence in your assessment of reach, impact and effort
Effort - labor costs / efforts

Reach
To avoid bias, answer the question: How many users will be affected by the changes over the period?
Whenever possible, take numbers from metrics, not from the air.
Example
The site receives an average of 5,000 visitors per month, with 50% of visitors coming from mobile devices. If we want to make an adaptive version, then the coverage will be 5000 x 0.5 = 2500 people per month
Impact
Focus on projects that actually move you closer to your goal by making an impact on your users or clients.
Intercom has developed a five-level rating system to assess the impact of a project:
3 = massive impact;
2 = high impact;
1 = medium impact;
0.5 = low impact;
0.25 = minimal impact.
Yes, the assessment is subjective, but this approach is still better than unexpressed feelings.
This is why it is important to review and learn regularly.
Value is understood differently in every product or project. The impact can be assessed using the following criteria:
Improves conversion from trial to paid version
Help attract new users
Helps retain current users
They add value to the product and set us apart from competitors. We are looking for opportunities that can give us a competitive advantage and create a reason why competitors' clients will switch to us. This competitive advantage must be unique, difficult to replicate and, ideally, non-reproducible.
Confidence
How confident are you in your estimates? Evaluations that are not based on metrics can be misleading. It is best to avoid such misconceptions by assessing the reliability of the estimates obtained, where 100% = high confidence, 80% = medium confidence, 50% = low confidence. Confidence below 50% is an alarming signal. Don't take on this project if you don't want to play roulette. Examples: Project A: The product manager has quantitative metrics for the impact of a feature, and an estimate of effort. Thus, the project receives a 100% confidence score.
Project B: The product manager has coverage and effort data, but is unsure about the impact factor. The project receives a confidence factor of 80%.
Project C: Reach and impact data may be lower than expected. Labor costs may be higher. The project receives a 50% confidence rating.
Effort (Labor costs)
Labor costs are estimated in terms of man-months, weeks, or hours, depending on the needs.
For example:
Project A will take about a week of planning, 2 weeks of design and 3 weeks of development, so the labor cost will be 2 man months.
Project B will only require 1 week of planning, 1-2 weeks of development, and will not require any design. Labor costs will be equal to 1 man-month.

Below is a file for calculations from the developer of the Intercom.com methodology
ICE assessment method
ICE was originally intended to prioritize growth experiments. Later, ICE began to be used to prioritize add-ons
Calculate the score for each feature or idea according to the formula:

Impact measures how much your idea will positively impact the key metric you are trying to improve.
Easy / Ease of implementation is about simplicity of implementation. This is an estimate of how much effort and resources are required to implement the idea.
Confidence measures how confident you are in the impact estimates and ease of implementation.

ICE uses a scale from 1 to 10 to ensure that all factors have a balanced impact on the final score. You can mean whatever you need by 1-10, as long as the values are consistent.
ICE Scoring has been criticized for its subjectivity:
the same rework may be assessed differently by the same person at different times. This may affect the final list of priorities.
if the additions are evaluated by different people, they will all evaluate it differently.
team members who want their ideas to be prioritized may manipulate results to gain approval
Links:
Video:
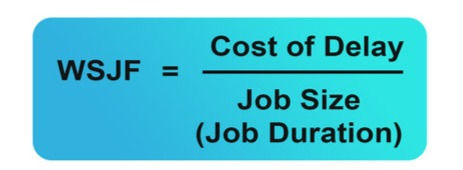
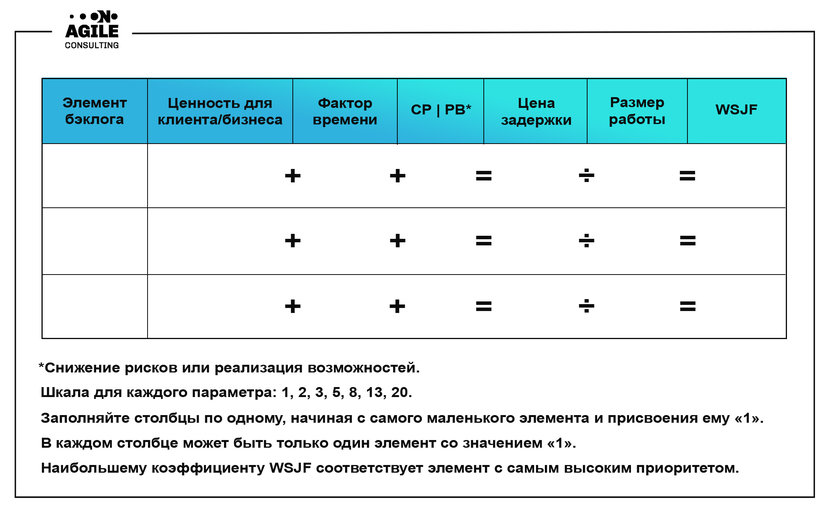
Weighted Shortest Job First is a method of prioritizing the sequence of jobs in a flow that provides maximum economic benefit.
As a result, we get a ranked list of tasks, where the first one is the easiest to implement, but at the same time the most valuable from a business point of view.
Calculation method
Step 1: Calculate Cost of Delay
To calculate the overall Cost of Delay score, each component must be rated on a scale. You can use a scale from 1 to 10, or the Fibonacci sequence - each subsequent value is equal to the sum of the previous two: 1, 2, 3, 5, 8...

User-Business Value —shows how much the completion of a specific task will benefit clients and the business.
Time Criticality - How critical is it to complete a task right now? To get ahead of competitors, meet a deadline, or open up opportunities to work on related tasks.
Risk Reduction or Opportunity Enablement is a factor that reflects how completing a specific task will reduce risks or open up opportunities.
Step 2: Calculate Job Size
You will then need to define a scale to estimate the amount of work that needs to be done for each of your ideas or initiatives. The scale may differ from the Cost of Delay scale, the main thing is that it is the same for all initiatives.
Determining this parameter can be difficult. It will vary depending on the resources you have right now, the skill sets on your team, dependencies, and external factors. But your team must agree and come to a common methodology by which each initiative can be assessed. Those that receive the lowest job size rating will become your priority.
Step 3: Divide Cost of Delay by Job Size
Divide the 1st parameter by the 2nd and rank initiatives by points from high to low
For example , if for one initiative the Cost of Delay is rated at 9, and the Job Size is 1, the score will be 9
If another initiative has Cost of Delay = 7, Job Size = 4, its score is only 1.75
Pros of the WSJF method:
Allows you to ask the right questions to determine priorities in software development for large companies.
Eliminates cognitive distortions in the process of prioritization.
It's easy to tailor it to suit your business needs as you can create a scale that suits your goals.
Disadvantages of the WSJF method:
It will take time and a lot of negotiations with stakeholders, experimentation and experience to achieve the optimal scale for your business.
You will have to try to get all the numbers and use the formula.
Tasks with unclear and large-scale requirements will be postponed in favor of tasks with clear estimates, which is not always good for business
Links:
Video:
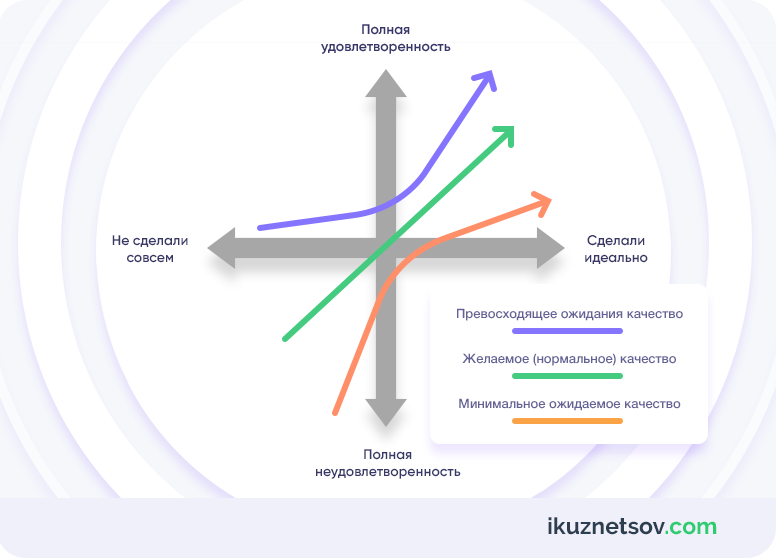
Developed in the 1980s by Professor Noriaki Kano, this model allows companies to classify the features of their products based on their value to the target audience.
The idea behind Kano's core model is that the more time, money, and effort you spend creating, implementing, and improving features in each category, the higher your level of user satisfaction will be.
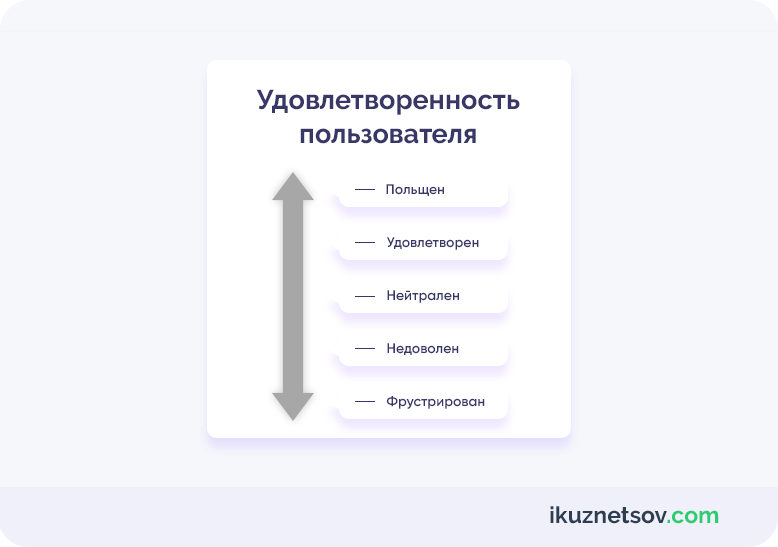
On the horizontal axis on the left are the needs that are not satisfied at all, on the right are those that are fully satisfied.
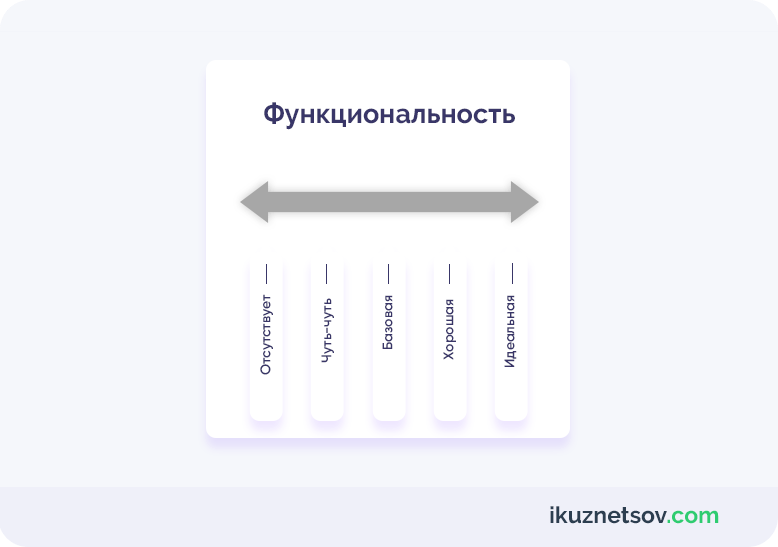
The vertical axis reflects the user's satisfaction level. The functionality scale shows how well a feature is implemented, from “not implemented at all” to “fully implemented.”
What it looks like assembled:
There are 2 types of model:
Californian , “simplified”, for young companies
Japanese , complete, for stable companies
California divides functions into 3 categories:
Required or basic functions. If you don't have them, the client will not consider your product.
Productivity features: The more you invest in their development, the higher the level of user satisfaction will be.
Delightful features: the user doesn't expect them, but they delight him
Japanese is a little more precise, there are 5 categories
linear, one-dimensional functions (Satisfiers, One-Dimensional, O) - as a rule, non-functional characteristics, for example, speed of operation, failure rate, etc.; everything is simple here - the higher the characteristics, the higher the satisfaction, the relationship is linear;
mandatory, basic functions (Basic, Must-be, M) – the lower right corner of the graph, those functions without which the product, in principle, will not make sense for the user;
attractive functions that cause delight (Delighters, Attractive, A) – the upper right level of the graph, those functions that cause a “wow effect” and a desire to buy or use the product that distinguish it from competitors;
unimportant functions (Indifferent, I) – the upper left corner of the graph, those functions that most users are completely indifferent to will be - okay, no - no one will notice;
unwanted functions (Reverse, R) – the lower left corner of the graph, those functions that cause irritation or rejection in the user (even if the product really likes them).
An example from the restaurant business:
The mandatory (or basic) need is for the restaurant to be clean and the food to be served on time. Without this, users will not be satisfied.
Normal (or productive) need: the restaurant serves delicious food.
Delightful (or attractive) need: A restaurant offers free treats with your order.
Indifferent Need : The restaurant has a self-service terminal.
The Kano model is useful if you need to prioritize product features based on user perceptions of value. Perception is the key word here. If the user lives in the desert, they will not be inspired by a raincoat. If you want to use the Kano model, you need to know your client well.
In order to get information from customers about their needs, you need to create a Kano questionnaire, filling which they will have to answer how they feel about each function.
The questionnaire should include questions:
If you had access to such a feature, how would you feel?
If you didn't have access to such a feature, how would you feel?
And these answer options:
I like it
I expect it
I don't care
I could put up with this
I do not like it
Then we collect all the functions (present or absent) into a scoring table:
Attractive - this feature is not expected, but customers like it
Mandatory – a required feature, customers are unhappy when it is not there
Effective - users like the presence and do not like the absence of this function
Indifferent – customers are indifferent to this functionality or are ready to tolerate its absence/presence
Controversial – contradictory and conflicting feedback from clients
Disapproved – customers like the lack of functionality and don’t like it when it’s present
Advantages of prioritization using the Kano model:
Helps the team stop overestimating exciting features and underestimating must-have features.
Helps the team make better product decisions and make market forecasts in accordance with audience expectations.
Disadvantages of prioritization using the Kano model:
Fiddling with the questionnaire can take a lot of time. To reach enough customers, you need to conduct an amount of research proportional to the number of your users.
Customers may not fully understand the features you're asking them about.
Links:
Video:
The HEART (Happiness, Engagement, Adoption, Retention and Task Success) framework was created by Google and is most often used in the digital sphere. Allows you to track the user experience (the designation UX, User Experience is often used for it) according to certain categories: happiness, involvement, acceptance, retention, success (completing tasks).
It is part of the Data Informed approach
It does not include specific metrics, so you will have to think through them individually. This is no coincidence, because different indicators are important for different products.
HEART divides all metrics into 5 categories
1. Happiness
Happiness metrics include, for example:
user satisfaction;
I feel like the product is easy to use
2. Engagement
Eg:
number of user visits per week;
number of photos uploaded by the user per day;
number of likes and sending links (shares)
3. Adoption
Acceptance may include:
updates to a new version;
user-created subscriptions;
purchases made by new users in the application.
4. Retention
Specific metrics here could be:
number of users remaining active over time
repeat purchases
5. Task Success
Key objectives could, for example, be:
successful searches;
photo upload time;
a completely completed user profile.
You don't have to try to come up with metrics that are important to your product in all of these categories. HEART is about choosing 1 or 2 truly important ones and focusing on them for a certain period.

Goals
For each category, the team generates goals, from which 1-2 key ones are taken into account. Priorities are determined based on the overall strategy and current business goals in the current period: year, quarter, month.
When there is a goal, you can formulate a task: what exactly needs to be changed in the product in order to achieve it. Afterwards, put forward hypotheses and select the most suitable ones for implementation.
Signals
A signal is something in user behavior that will indicate success or failure in achieving a goal.

Metrics
A metric is a numerical measurement of a signal over time

Example of using the framework

Links:
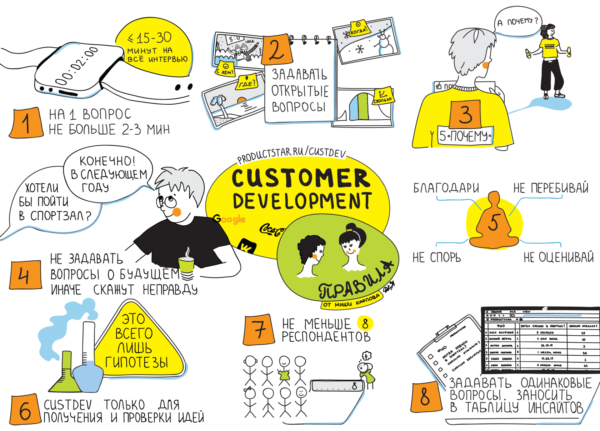
CusDev (Customer Development) is a study of client needs through special “in-depth” interviews. Research is carried out to test an idea or prototype of a product on a potential audience and understand how much the product will be in demand.

CusDev is a qualitative rather than a quantitative tool, meaning the data collected is treated as ideas and hypotheses that are subsequently tested with quantitative experiments (for example, surveys or test runs with analytics).

Let's take a closer look at the most popular research methods:
Deep (user research).
Most often these are problem or solution interviews. The first type helps you understand whether the user has a problem from which your product should (or is already eliminating) him.
The purpose of decision interviews is to understand whether your product solves the user’s problems, and if not, what features need to be added. To conduct a decision interview, you need at least a prototype

Quantitative surveys.
These are questionnaire tests. There are no clear restrictions on the sample: the number of respondents can vary from 10 people to several thousand.
A/B tests.
They compare specific elements of a product (design of buttons, banners on a website, etc.) and ask the respondent to choose the best one from those presented.
CusDev allows you to:
- understand whether the consumer needs the product, whether clients really have this pain;
- does the product solve this pain?
- draw a portrait of the client;
- adapt the product to the target audience;
- make the very product for which the consumer agrees to pay money.
Advantages of CusDev:
Assessing customer needs for a product before investing in it. The research shows whether the audience is ready to buy the product or not.
Favor of investors. Sponsors invest money when they see results from target audience research that are beneficial to them.
Elimination of incorrect company expectations. The method shows where manufacturers went wrong.
Flaws:
Requires time investment. Research delays the creation of the product itself or its adjustments.
Revealing secrets about the product. CustDev reveals secrets about a new product as research progresses.
Checklist: when to use CustDev
Situation No. 1 - you are creating a product in an existing market. What you need to understand:
rules of the game: who is already on the market, who is the leader, what is the pricing policy;
how people choose similar products, which is important to users;
what the user is satisfied and dissatisfied with, what problems he experiences when using existing services.
Situation No. 2 - you are creating a product in a new market. What you need to understand:
who are the future consumers;
what problems they face, what needs potential clients have;
how important is it to solve this problem;
whether demand can arise in principle;
what the product lacks to be in demand.
Situation No. 3 - the product already exists. Improve the product, service, increase sales. What you need to understand:
why consumers choose you;
why they buy from competitors and not from you;
in what situations and life circumstances your products are consumed;
who exactly consumes;
who makes the purchasing decision;
what is the current process for using your product.
Interview stages
1. Formation of a hypothesis
At this stage, a needs research is carried out: what the consumer lacks and what products are still not on the market. For example, the team came up with an e-book rental service where you can pay for access to books for a week. At the same time, the cost of rent will be lower than a full purchase. This approach, according to the team, should stimulate the reader, since reading time is limited.
2. Segment selection
In CustDev, the audience is divided into groups based on demographic characteristics (for example, gender, age, marital status), behavioral characteristics (for example, habits, purchases, services in demand), geography and social status. Segmentation helps to personalize the offer, make it relevant and determine the approximate cost of the product that will be acceptable to the buyer.
The future e-book rental service will have two age segments in the audience: 16–25 years old and 25–35 years old. In each of the groups, the emphasis is on people who strive for self-development and discipline, participate in challenges and marathons, study time management and spend from 300 rubles a month on books.
3. Compiling a list of interview questions.
Questions help to consider the client's pain, identify a need and understand how best to satisfy it. For example, if the market still does not have high-quality services for selecting psychotherapists, searching for contractors or renting a car. Depending on the product, the list of questions may vary, but in general it is important to talk with customers about the following aspects:
How do users currently fill their need for the product, how much do they pay for it, and how satisfied are they with the solution?
What exactly causes inconvenience?
How do they see the ideal solution to the problem (result, cost)?
What happens if they can't solve the problem?
When was the last time the user encountered a problem and what emotions did the situation evoke in him?
4. Search for potential buyers
Each person in the target group is not just a respondent, but a potential buyer of the product. When conducting an interview, it is important to find out why he is interested or not interested in purchasing, what does not suit him, and whether he has alternatives. Based on the responses of 10 people, you can already form a rough picture, but the more respondents, the deeper the audience’s understanding will be.
You can search for people to participate in the study using any channels: personal acquaintances, social networks, offline events, announcements from bloggers or on websites. The only important thing is that they fall into the target group of the project. Potential participants should be immediately warned that detailed answers will be required from them, and the interview itself will take some time.
5. Conducting interviews
You can communicate with the audience in 2 different cases: when the company just identifies a request and when it offers to test a ready-made solution, which is why interviews are divided into 2 types: problem-based and solution-based.

6. Data processing
The results of the study can be summarized in a table:
Write questions on the top line.
In the first column, indicate the names of the respondents.
Write down their answers to each question in the columns.
Insights from users and notes from the interviewer can be placed in a separate tab so as not to be lost. In addition to tables, you can use graphics or mind maps to visualize the results.
It is important to remember that in the CustDev methodology, the product rarely meets the client’s expectations the first time. One person can guess the expectations of an entire target group only if he has been working in a certain area for a long time and is launching a new branch of business in it. In other cases, it is important to record consumer dissatisfaction and take into account his arguments.
Brief reminder:
- work out the hypothesis being tested in advance
- Allow 2–3 minutes for one answer, and no more than 30 minutes for a full interview.
- record the interview on a tape recorder or camera in order to draw conclusions later.
- 10 - 15 questions in total
- you can ask questions in which the respondent himself will tell you about the advantages and disadvantages of the product / his pains
- 2 interviewers per respondent. While one interviewer is communicating with the interlocutor, the second is monitoring his reaction and recording key points of the interview.
What not to do during Customer development:
try to confirm a hypothesis rather than test it;
make the user a usability expert;
speak professional language;
ask superficial, closed questions for castdev;
offer answer options or push for something;
argue with respondents, interrupt them, or vice versa - encourage them;
paraphrase answers or make them up;
explain something without asking;
forget to thank you for the answers.

Also, when launching a new product, you may find it difficult to reach your target audience. Try to find events that your target audience goes to. And start the conversation with “Have you encountered such a problem...”. Prepare 3-4 hypotheses to start with and start communicating with them. This will be your entry into communication.
Links:
Video:
The AARRR (Acquisition, Activation, Retention, Referral, Revenue) method determines the success of a project using a conversion funnel and helps increase 2 vital indicators for the product: the number of active users and revenue. Its second name is “Pirate Metrics”.
The framework consists of five stages:
A acquisition - attraction.
A ctivation - activation.
Retention - retention.
Revenue - desire to pay.
Referral - desire to recommend.

There is another variation - AAARRR. Stage 1 is Information/Awareness

Mainly used in 2 cases:
When you have a ready-made business and you need to scale it
When to work out the customer journey (CJM) and determine the business model
The stages of the funnel can be worked sequentially or interchanged depending on the specifics of the product, the buyer's journey and business priorities. At any given time, you can focus on one or more letters at the same time.
Example 1. How the method works in a large company with a massive international product.
Nescafe launched a smartphone application in 2014: a video alarm clock. It's a small social network with friends. How does the AARRR method work in this product?
A - Attraction. The company announces that now you can wake up not to annoying melodies, but to funny and invigorating videos. You download the app so your phone can set a video as an alarm.
A - Activation. There are several actions here at once.
1. You set an alarm and choose who will wake you up: a random person or a friend. There are telephone analogues of such a service.
2. Record your video to wake up others.

R - Hold. Log in with Facebook to wake up the next day to videos from your friends and acquaintances.
R - Recommendation. Share with friends via Facebook and recommend the app to them. Because it's funny.
R - Income. The brand is growing a loyal audience - active users of smartphones and social networks.
Example 2. from Alexey Badin from his telegram channel Andrey Badin. Manage differently. In this example, he examines the reason for the failure of the vaccination campaign from the perspective of Product Management and Change Management (there will be a separate post about this area).
Andrey Vulf sent an interesting picture about how bad everything is with vaccination. Since a vaccine is a product, and vaccination is a change in people’s behavior, it would be correct to consider errors from the point of view of product management and change management. I do not pretend to be complete, rather these are my thoughts as a user.
Change Management and Vaccination
1. There are 2 approaches to changing people.
Approach 1: We change their attitudes/thinking, then they change their actions.
Approach 2: change their actions, which will lead to changes in attitudes.
The choice of approach depends on the ability to quickly change attitudes or actions.
2. Approach 1 is slow, but strategically more reliable, approach 2 is fast, but you can roll back.
Example 1 - quit smoking. Approach 1: a person must realize that it is bad and learn to quit. Approach 2: we create conditions when a person cannot smoke and later he will change his attitude. Approach 1 is better here (difficult to change actions).
Example 2: introduce electronic document management in a company. Here it is better to ban paper by giving a new tool. Better approach 2 (actions are easy to change).
3. In the case of vaccination, it must be taken into account that the majority of the country’s population is brought up in the paternalistic Soviet approach. That is, people are made into dependents who are dependent on the state. Should I use approach 2 here?
No, the essence of the Soviet system is the ability to force anything. People agreed to this dependence, so they will not resist much. Games of democracy are inappropriate here, because people gave up their freedom in exchange for passivity and stability. The first mistake of vaccination was here - playing at democracy when it is not appropriate.
4. The rest of the population thinks more independently. Innovators and followers of new technologies (according to the Moore curve) will not wait at all and will be vaccinated first.
Product Management and Vaccination
The goal is to non-forcefully and quickly vaccinate independent-minded people. Here you can use the ADKAR funnel from change management, but it is outdated. Why - I will write about this later. It is better to use the modernized AAARRR funnel (it is also not ideal). For the purposes of the case, I will use other names of the stages. From the point of view of the funnel, you need to quickly move everyone through it, from awareness of the problem of Covid to vaccination and recommending vaccination to everyone you know. What errors were there:
1. Awareness
Awareness of the covid problem. The population 45 years of age and younger has largely not realized the problem. That is, they did not even pass this stage. Objection - young people easily tolerate Covid, so why do I need vaccination... Solution - more cases about how young people are on ventilators, how they infected their parents, grandparents, who... I rarely watch TV, but when I did, there was an advertisement about how cool we are in the West... But it had to be shown... I didn’t see any activity on the Internet on the topic of awareness of the problem, but the youth were all there...
The realization that Sputnik will help in the fight against Covid. This is also a failure. There are many articles on the Internet that Sputnik is not recognized by the West because it was launched in violation of standards and the data is still being hidden. Of course, our person will believe this, because he knows that we are constantly being deceived... In addition, instead of launching one product, they launched 3 products that compete with each other. As a result, I have many friends who were waiting for Kovivak, because it’s kind of better than Sputnik. And now that they have introduced it, there are also questions about its recognition.
2. Interest or Acquisition.
Interest in the product. In business, contacts are collected here through lead forms. The same thing could be done here - collect information for those interested in getting vaccinated. This did not happen. I've been at this stage for a long time. I was ready to leave my contacts so that they would send me useful information, articles about vaccines... But this did not happen. And it’s important to measure how many people are here. It was not difficult to do this through government services.
3. Desire or Activation. Desire to get vaccinated.
Here in business there are usually samples, free versions of the product or something that provides value. This does not apply to a vaccine, but planning vaccination dates and locations may be involved (this moves me further along the funnel closer to vaccination). I spent a long time figuring this out, there was different information from friends, it’s better to register at the clinic or come to the point and it will be faster in line. In the end, I chose a non-optimal point, there was no help...
4. Retention. Keeping me from getting vaccinated so I don't fall out of the funnel. No one was in control of this process. I see this from my friends who are at this stage. No nudging from behavioral economics. But now it’s the holidays, it’s just physically difficult for some to find 2 dates in 3 weeks. Here we need to help find these dates and now choose a vaccine.
5. Action or Revenue. Here is the stage of vaccination itself.
In general, in my experience everything was fine...
6. Referral. Vaccination recommendations from those who have undergone it.
Some people post themselves, but in general this is a key stage, people trust recommendations more, we need to help such people: send a beautiful electronic certificate for posts on social networks. Wallpaper for FaceBook as it happened with I/We Together. Come up with hidden benefits for those vaccinated so that people will promote it. In fact, they are only now starting to do this. In general, the essence of the funnel is that we know how many people we have at each stage, we know the speed of movement along the funnel, we know what the conversion rate is from stage to stage and how it can be improved.
The problem is that we have not yet learned how to use soft approaches to change people's behavior. The West is decades ahead of us. They use more complex tools there, such as the Overton window. In our country, they can’t even change the vaccination policy yet. But let's be optimistic, maybe everything will work out.
Links:
Video:
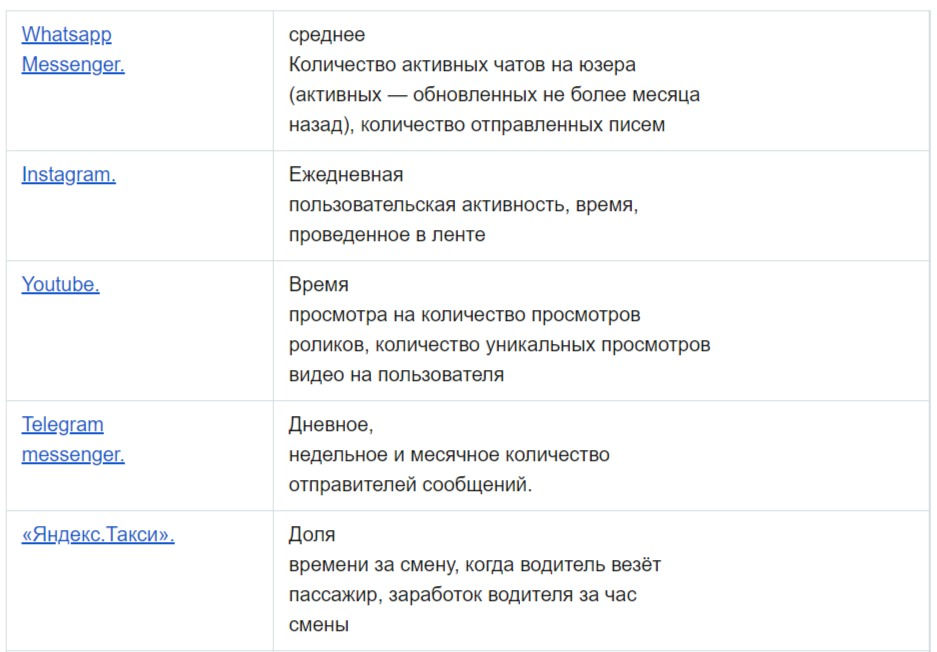
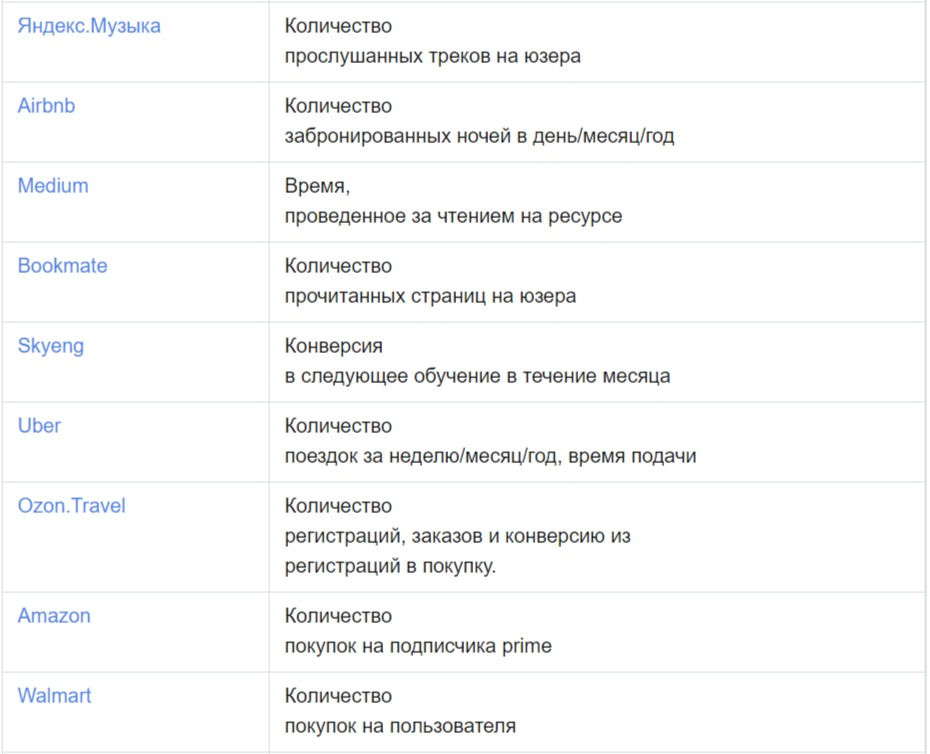
A metric is a qualitative or quantitative indicator that reflects a particular characteristic and level of success of a product.
We recommend using no more than 4-5 indicators in project, product and any management. This is the golden mean, which allows you to show the situation in sufficient detail, conduct an analysis from different angles, and not overload you and your colleagues during meetings and discussions.
We had experience when in one project to implement a digital system there were about 40-50 metrics. As a result, weekly meetings lasted 3-4 hours, no decisions could be made and everything came down to the opinion of 1 supervisor.
There are NO universal metrics; they must be selected for your product and your industry. Metrics should depend on business goals. Before choosing which metrics to measure, think about what you want to achieve.
But there are criteria that must be met:
Comparativeness, changeability over time. The metric should tell you whether the product has become better and more popular or not.
Clear for the entire team, not just 1 person.
Influencing behavior and decision making. The metric should be your guide and encourage you to take action. And not a “digit”, so to speak.
4 strategies
There are 2 strategies for how to approach working with metrics:
No-data
Management and decision making without taking into account data and analytics. It is used by a dominant number of managers and organizations.
Data-driven
Data-driven management. First they get the numbers, and then they make decisions based on them. The team selects metrics and calculates the indicators. The numbers they receive are the first thing they will look at when deciding where to go next.
Data-informed
Data-driven management. Metrics only partially influence decisions made. Indicators are important, but not the main thing. You can focus on them in one case and not take them into account in another.
Now the first approach is the most popular, especially as part of the transition to the digital economy. Everything should be measurable. But the second one is also gaining popularity. Some global companies realize that they cannot measure everything and not take into account all the information when developing metrics. Example - FaceBook.
Data-inspired
An approach in which analyzing the market and trends, searching for non-obvious connections in disparate data serves to make strategic decisions and search for new opportunities. The key thing is that we do not rely on experience and analysis of events, but on a vision of the future and research. Allows you to build a strategy, but has the greatest risks.
Read more about these strategies in the article Data-driven or data-informed: why won’t digital replace humans?
Examples of metrics that are used in life

You can also use the following checklist of questions to search for metrics during startup:
Value : Does this metric reflect the user's experience of the core value of the product?
AHA Moment : Does it reflect the moment when users first experience the core value of a product?
Business : Is this the only thing that shows the business is moving in the right direction?
Analytics : Does the metric show the level of actual interaction and activity?
Strategy : Is the metric linked to the long-term value of your product?
Examples of metrics for different industries and types of business:
B2B one-time contracts
1 - Bookings - total cost of all signed contracts ($)
2 - Total Customers - number of clients with concluded contracts
3 - Revenue - revenue ($)
B2B subscription services
1 - MRR (Monthly recurring revenue) - monthly recurring revenue ($)
2 - ARR (Annually recurring revenue) - annually renewable revenue ($)
3 - Gross MRR Churn - loss of monthly revenue due to unsubscribed customers ($)
4 - Paid CAC - cost of attracted client ($)
Subscription - B2C (Netflix)
1 - MRR - monthly renewable revenue ($)
2 - MRR CMGR (Compound Monthly Growth Rate) - monthly growth rate of renewable revenue (%)
3 - Gross user churn - lost subscribers ($)
Transactional (PayPal)
1 - Gross transaction volume - total transaction volume ($)
2 - Net revenue - revenue from commissions ($)
3 - User retention - customer return (%)
4 - Paid CAC - cost of attracted client ($)
Marketplace (Airbnb)
1 - GMV (Gross merchandise value) - total volume of transactions ($)
2 - Net revenue - revenue from commissions ($)
3 - Net revenue CMGR - monthly revenue growth rate (%)
4 - User retention - customer return (%)
5 - Paid CAC - cost of attracted client ($)
E-Commerce
1 - Monthly revenue - monthly revenue ($)
2 - Revenue CMGR - monthly revenue growth rate (%)
3 - Gross margin - profit ($)
4 - Paid CAC - cost of attracted client ($)
Advertising (Twitter)
1 - DAU (Daily active users) - daily number of active users
2 - MAU (Monthly active users) - monthly number of active users
3 - Percent logged-in - share of logged-in (%)
Hardware (GoPro)
1 - Monthly revenue - monthly revenue ($)
2 - Revenue CMGR - monthly revenue growth rate (%)
3 - Gross margin- profit ($)
4 - Paid CAC - cost of attracted client ($)
North star metric
The north star metric (NSM) is an indicator that reflects the core value of a product to users. A properly chosen “north star” metric can provide a company with stable and sustainable growth in the long term.
The NSM indicator should include three main parameters:
Profitability - this indicator shows how much the company earns.
Value for users - the indicator reflects the core value of the product for customers.
Measurable - the indicator is easy to measure.

North star metric:
Helps the product team clearly see what needs to be done to improve NSM performance, and which features can be moved to the specification or completely canceled. Much like a little road map.
Allows you to see the progress of the entire company in numbers and speed up the implementation of product initiatives.
Gives you the opportunity to see concrete results from the work done.
If you have a complex product or a large company with a complex ecosystem, one indicator may not be enough. But having more than 3 main indicators is also bad, the idea of a key metric disappears and you can easily lose focus.
4 NSM measurements
Each metric has 4 dimensions: depth, breadth, frequency, and effectiveness. Each KPI can work on one of these dimensions.

LTV and CAC
LTV and CAC are metrics that ultimately determine the financial success of a product.
LTV (Live Time Value) is the money the average user spends on your product over the entire time they use it.
CAC (Customer Acquisition Cost) - the cost of attracting an average user.
Links:
Video:
Loyalty is what turns regular customers into regular ones. And to achieve it, brands are doing their best: launching programs with discounts and bonuses, making their website as clear and convenient as possible, hiring consultants who respond to clients around the clock

Customer Satisfaction Index – an indicator of customer satisfaction. The idea behind the indicator is that satisfaction depends not only on the characteristics of the product or service, but also on the importance of these parameters for the consumer. The index is calculated to solve the following problems:
Identification and ranking by importance of key product parameters that affect customer satisfaction;
Determining the level of satisfaction with each of the parameters separately;
Obtaining a numerical indicator reflecting an opinion about the product, taking into account the significance of each parameter;
Conducting an analysis of various consumer groups and comparing satisfaction for each target audience.
CSI is measured in 2 stages:
First, they determine by what parameters satisfaction with the product will be measured. There can be many of them, and they depend on the specifics of the brand: the Internet speed of the provider, the quality of printing in a book publishing house - and so on. But the 5P criteria can be taken as a basis: Product, Price, Place, Promotion, People - satisfaction with the product itself, price, place, promotion, people. For example, did the 24-hour consultant help or did the manager who confirmed the order over the phone speak politely?
Then they collect data using personal CAPI and PAPI surveys, telephone CATI and online CAWI. The surveys have two sections: the first one asks how important each parameter is to customers, and the second one asks how satisfied they are with these parameters. Usually in both cases a rating is used on a scale from 1 to 7, but not necessarily. Sometimes the questionnaire includes additional questions that require a detailed answer (as with NPS) or allow you to judge satisfaction not with a specific product, but with the brand as a whole.

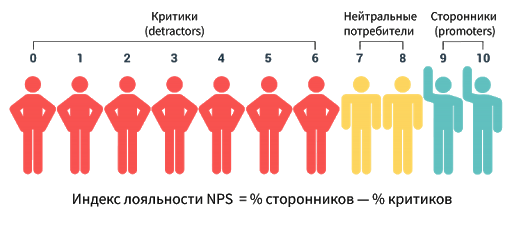
NPS
Net Promoter Score is a tool for identifying the degree of customer commitment to a brand, based on the consumer’s personal experience. In the process of calculating the index, the share of loyal consumers and problem areas of the product and service are determined.
It's easy to measure and just as easy to interpret:
You ask how likely, on a scale from 0 to 10, the client will recommend your brand to his friends: 0 - never and never, 10 - definitely, even today.
Divide the answers received into 3 groups, as a percentage. Critics are those who rated it from 0 to 6. They are unlikely to recommend you to anyone, perhaps they will even dissuade you. Neutrals are those who gave 7 or 8. They seem to be satisfied, but they are unlikely to recommend you. Promoters are the ones who gave you 9 and 10 points. They have the most pleasant impressions of communicating with you, and they will really recommend you to their friends.
Subtract the % of critics from the % of promoters - this is the NPS.
Links:
Unit economics is an economic assessment of how much you earn on each sale. It demonstrates the economic viability of the business and its ability to scale.
There are 2 basic approaches to calculation:
1. A unit is a unit of goods or services: a table, a chair, a car, any physical product
Here we calculate fixed and variable costs, calculate the cost of production and look for margin

2. The client is the unit
The main criterion here is how much money the client brings in while using the service and how much it costs to attract him. That is, just LTV and CAC, which we discussed above.

Unit economics is calculated in 4 stages:
1. Define a business unit: product/service or client
2. We calculate the unit cost (how many clients came, what are the costs of marketing and advertising, production costs)
3. We calculate how much one client/unit brings in on average
4. We consider how profitable the business is overall, what is the marginal profit.

Detailed algorithms and calculation examples, key metrics, including a calculation simulator, are available at the links below.
Links:
Another tool we want to talk about is Occam's razor.
The most well-known formulation characterizing this tool is: “Entities should not be multiplied beyond necessity.”
Why did we highlight this tool? In our practice, we often observe that companies begin to create a large number of products and by-products that do not differ from each other for the consumer. The result is a complex jumble in which consumers begin to get confused and not understand:
Why should I update my phone after a year?
Why should I buy a paid subscription?
How does your solution differ from what I have?
This is a fairly simple, but quite important tool in creating products.
CRL is an approach to assessing the level of readiness of a technology/product for commercialization. Allows you to understand how ready the product is for launch and how ready the market is to accept it. It is most appropriate to use for high-risk products with capital investments.
CRL 1. Determined the presence of market needs based on literature sources: trends, reviews, conferences, patenting dynamics
Potential customer/market needs identified: trends, reviews, conferences, patenting dynamics. The main quality indicators have been determined. Reviewed by external experts. PAM (Potential Available Market) is determined - the potential market volume.
CRL 2. Target customer segments identified and assessed
Target consumer segments, key competencies for creation and advantages of the technology/product are identified. A comparison was made of critical parameters and economic assessments with competitors, taking into account market dynamics. An analysis of market reviews and conference results was carried out. Feedback from potential consumers was received. The feasibility of the project was determined. Estimated TAM (Total Addressable Market) - the total volume of the target market.
CRL 3. Conducted competitive analysis, supplier analysis, clarified product characteristics, monetization methods
Competitive analysis and supplier analysis were carried out, product characteristics and monetization methods were clarified. A product strategy has been developed. Quantitative economic benefits for the consumer are assessed. The appearance of the competitor has been determined. Conducted by CusDev. The product niche has been clarified and the market share by segment, including the global market, has been clarified. Options were considered and the pros and cons were determined. The availability of components and materials on the market was determined. An assessment of the cost of ownership has been made. Materials have been prepared for presentation to investors.
CRL 4. Competitors, suppliers, pricing models clarified
Competitors by sector have been clarified, SAM (Served/Serviceable Available Market) – available market volume – has been assessed; Product characteristics were clarified and the pricing model was adapted. Product strategy is protected at the company level. Investors have been identified for contact at the next TRL level. Suppliers of critical components with whom exclusive agreements need to be concluded have been identified.
CRL 5. Pricing policy clarified, sales channel selected, priority suppliers
Based on the results of testing the experimental sample, the price model was updated and the pricing policy was clarified. A sales channel and priority suppliers have been selected, and supply channels for components/materials have been diversified. Resources have been prepared to work with investors.
CRL 6. Clarified product specifications for each target segment, refined business model
Based on the results of TRL 5 , product specifications for each target segment were clarified and the business model was clarified. Specifications have been developed for each consumer segment. Resources have been prepared to work with key persons.
CRL 7. Pre-market launch
Competing products in the international market were clarified and critical software benefits were clarified. Business schemes and basic terms of cooperation have been determined. A pricing policy has been developed. A financial plan has been prepared, including financial indicators for the project. Estimated SOM (Serviceable & Obtainable Market) - realistically achievable market volume. Preliminary launch to the market has been carried out. The hypothesis about sales channels was tested and confirmed. Price lists have been released. A marketing plan has been prepared. Written confirmations of interest have been received from partners/potential customers.
CRL 8. Addressing customer comments
Test sales were carried out in accordance with the marketing strategy. Customer comments based on the results of preliminary sales were processed. Feedback from users on competitive advantages was received. Sales business models are recorded. A sales and service system has been organized.
CRL 8. Market launch
Bringing products to market. Improving marketing strategy. Preparation of requirements for a new version of the product. A quality management system has been implemented (for example, ISO 9000).
MRL (Manufacturing Readiness Levels) or UGP (production readiness level) according to GOST R 58048-2011 is an assessment of how ready our production is to produce an innovative product. Production readiness has 10 levels:
UGP1: The main factors influencing production are identified;
UGP2: The production concept is defined;
UGP3: Production concept confirmed;
UGP4: The possibility of manufacturing technical means in laboratory conditions has been achieved;
UGP5: The ability to manufacture prototypes of system components in appropriate production conditions has been achieved;
UGP6: The ability to manufacture prototypes of systems or subsystems in appropriate production conditions has been achieved;
UGP7: The ability to manufacture systems, subsystems or their components under conditions close to real ones has been achieved;
UGP8: The pilot production line was tested, readiness for the start of small-scale production was achieved;
UGP9: The possibility of small-scale production has been successfully demonstrated, the basis for full-scale production has been prepared;
UGP10: Demonstrated full-scale production, introduced lean manufacturing practices.
In this section, we share a general summary of what hard skills a product team should have. What tools are there and what are they used for.


Links:
Landing
Separately, we would like to talk about the landing page, or product page on the Internet. It is believed that this is a mandatory element in product promotion. And we agree with this. But it makes no sense to think that it will automatically launch sales or allow you to test a hypothesis. Search networks simply won’t see you properly.
Before you launch a landing page, think about where your client should come from? If this is through a request on the Internet, then you need a website with useful material, SEO links, keywords and links. Then search engines will recommend you. And on a one-page website it is too difficult to create the necessary content. If you are lazy, then prepare a solid advertising budget.
If your target audience lives on social networks, then you need a community to which you again need to attract an audience. But with what? The answer is the same, with useful materials that are accessible, understandable and practical. As a result, a product landing page on the Internet is absolutely necessary, but it will only work in combination with other tools
And so you created a landing page, or even a page with useful content, it is gaining popularity, but there are still no sales? Everything is fine, you need to find a value proposition, an offer that the client wants to buy.
It is extremely difficult, sometimes impossible, to do this the first time. Therefore, first you need to learn how to communicate with clients and understand what they need. For example, in-depth interviews, CusDev will help with this
You also need to build the structure of the page taking into account the customer journey , assemble a so-called funnel: explain to the client your essence, his problem, as clearly and clearly as possible, so that he identifies himself with you, convey to him your value proposition, provide convenient communication channels
Well, then you need to conduct AB tests to find the right words and design solution. Even after launching a landing page and bringing a client, you need to be flexible and communicate with the client, preferably directly, then you can achieve results.
As a result, of course, in a simplified manner, we can recommend a certain universal algorithm for launching new IT products that you will have as a result of digitalization and digital transformation.
1. Primary description of the product idea:
detailed description of the idea;
value proposition;
analysis and selection of technologies on which the solution will work.
2. Detailing and confirming the viability of the idea:
market analysis and identification of competitors with their pros and cons;
conducting CusDev interviews;
formation of CJM
determining the metrics of your solution;
exploring potential risks and identifying triggers that you will monitor. It is advisable to do this based on the metrics of your product
developing strategies and tactics for dealing with risks;
creating a primary financial plan and economics solution for you and your client;
It is desirable to create a backlog of product requirements;
perhaps creating a roadmap and developing a marketing strategy;
Description of the Canvas model is required
3. Primary prototyping:
conceptual description of the solution architecture;
choosing an MVP, what it will include in order to realize the value of your product at a minimum level, that is, a minimum set of mandatory requirements;
description of UX design, at least for MVP, how the solution should work on a global level, what will interact with what
drawing of UI design, also at least for MVP, including detailed descriptions of individual screens of your solution: where and what buttons are, what their function is, what the work area looks like;
4. Return to point 2 and critique it based on what you understand about your product. If necessary, adjust your materials. I also recommend creating a roadmap and marketing strategy now. These can be done in step 2, but the better you understand your product, the better you can master these tools.
5. Creating an MVP and analyzing what you saw, adjusting plans and requirements, promotion strategies, possibly admitting a mistake and closing the project.
6. If the MVP is successful, then we move on and constantly collect feedback (the articles contain useful materials), periodically conduct CusDev, and use tools for prioritizing requirements and new ideas.
It will take you about 6 months to go through these stages. Of course, if your solution is very local, then you can complete it in 3 months. But remember the chapter on project management: the better you work out the initiation and planning stages, the cheaper and faster you will move later.
Well, a few key principles.


An example is the sale of products at a Russian Post office.

And remember the product life cycle

Interview from a practitioner and Yandex product director
Product Matrix Management
Channel about the project and product approach from Yandex Academy
Well, with the most attentive and patient, we will share our “secret” sauce.
Our credo in business has always been the combination of:
quality product
streamlined processes
competent and motivated team
But gradually, based on both our experience and world experts, we come to the conclusion that one more point is needed here - public speaking.
On the one hand, a competent and motivated team (experienced product manager and marketing) is already implementing this task.
On the other hand, we find this competence only in a few.
The ability to work correctly with the outside world is a rare quality even among recognized TOPs, often:
this does not exist at all;
perform not for the target audience;
cannot tell about themselves simply and clearly. So that the target audience understands;
Such a presentation that you just fall asleep.
At the same time, public speaking is one of the best ways to attract clients with money. Here we recommend reading Geoffrey Moore and his research. He has a whole book about it.
But what's the secret sauce?
1. Work with the feed. You just need to take public speaking courses and practice. Experience and training.
2. Look for events where your target audience goes, not like-minded people
3. Tell us about yourself and the product simply, in your fingers. In 90% of cases, your terms will not be understood. Both an 8-year-old child and a 60-year-old pensioner should understand.
4. Think about your audience: what tasks, pain points they have, how to solve them, including with the help of your product.
Nobody wants to listen to you again for 15-20 minutes about how great you are.
To do this, you need to understand who will be at the event, what are the specifics of their business, and even better, their positions, what problems arise from this?
Do you think it will be interesting for the CEO to hear about all sorts of microservices, and for the CIO about the problems of the operations department?
To reach an acceptable level of speakership, you don’t need much:
6-12 months of training
15-20 performances per year
smart designer on the team.
Then your slides will be photographed, word of mouth will spread about you, and the sales department will smile. Well, you will be able to throw out hypotheses and observe the reaction of the audience, plan where to direct resources.
As for us, to hone his skills, our founder Jimsher Chelidze is a member of a number of speaker communities, for example here https://bestspeakers.ru/listing/chelidze-dzhimsher/
Well, we recommend learning and taking the first steps from https://oratorkruc.ru/