Lean production. Part 2 + 6 Sigma
- Джимшер Челидзе
- May 31, 2024
- 13 min read

Updated: Jul 8, 2024
Content:
This is the 2nd post about lean manufacturing. In it we will look at some lean manufacturing tools, as well as what 6 Sigma and Lean 6 Sigma are.
Part 1 is available here
One of the lean manufacturing tools, along with SIPOC . Value Stream Mapping is a tool that visualizes the process of transforming raw materials into finished products sold to consumers. Its objects are material and information flows of resources, as well as time.
Creating Value Stream Mapping is divided into three blocks:
A production or process flow is a traditional flowchart in which, from left to right, the path of value creation is recorded, starting with the purchase of raw materials and ending with the shipment of products. If, in addition to the main process, there are additional or auxiliary ones, they are applied under the main one. In this way, the main tasks are separated from the secondary ones.
Information or communication flow - at the top of the value stream map, arrows depict information flows that occur in parallel with production. Both formal and informal data exchange are taken into account. Information flows are plotted on the map in free form, as they flow in reality.
Timeline and distances are lines that are drawn at the bottom of the map. The time line is divided into upper and lower parts. The lead time is displayed at the top - the waiting time. The cycle duration is shown below. Below the time line there may be another line, at the very bottom, showing the distances along which the product or personnel move within the process.


Simplified operation algorithm:
Step 1. Selecting a process for systematizing the value stream (preparatory)
Step 2: Value Stream Mapping Symbols
Step 3: Defining Process Boundaries
Step 4: Process Steps
Step 5. Adding information flows to the map
Step 6: Add data about each step of the process
Step 7. Inventory counting
Step 8. Adding process chronology - Timeline
Step 9: Future State Map
Step 10: Plan for Implementing Improvements
Useful links:
Video
Poka-yoke (poka-yoke) is one of the lean manufacturing tools. In Russian it sounds like “ protection from a fool .”
Anti-fool devices protect not just from errors, but from errors caused by human factors:
inattention
forgetfulness
carelessness
ignorance
tired
and even sabotage.
People make mistakes, and poka-yoke devices prevent them from making mistakes.
The operating principle of poka-yoke is characterized by:
100% verification coverage
fast feedback
low cost and simplicity.
Poka-yoke devices work on the principle of not missing a single defect.
They regulate the production process and prevent defects in one of two ways:
Control system - stops the equipment when an abnormality occurs, or blocks the workpiece with clamps so that it does not move further along the conveyor until it is processed as required. This is a preferable system because it is operator independent.
Warning system - sends a signal to the operator to stop the machine or correct the problem. Depends on the operator, so the human factor is not completely excluded.
Poka-yoke does not blame people for bugs , the goal is to find and fix weaknesses in the production system that made the bug possible.
Fool-proofing methods are divided into 3 levels in order of increasing effectiveness:
Level 1 - detects non-conformity of parts or products . The system detects the defective part, but does not discard it.
Level 2 – does not allow non-compliance. The system prevents the defective part from being processed at the next stage of the production process.
Level 3 - structural protection , for example, the product is designed in such a way that it is impossible to install or assemble it in an unintended manner.
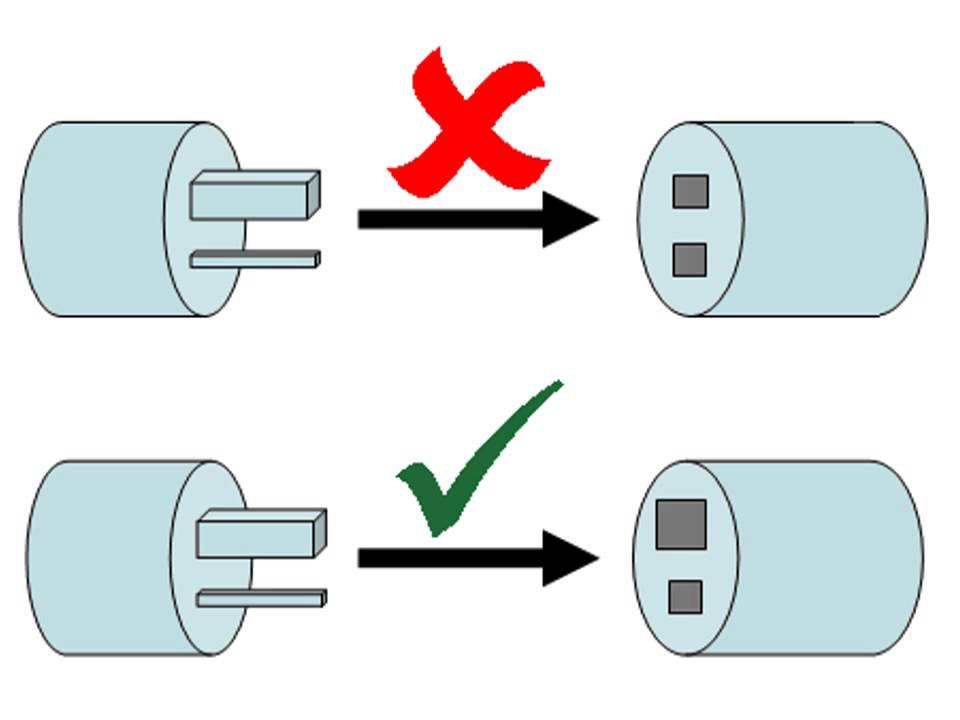
Error Protection Principles
Elimination : This method eliminates the possibility of error by redesigning the product or process so that the problematic operation or part is no longer needed at all. Example : simplifying a product or connecting parts to avoid defects in the product or assembly.
Substitution : To improve reliability, you need to replace an unpredictable process with a more reliable one. Example : Using robotics and automation to prevent manual assembly errors. Use of automatic dispensers or applicators for precise dosing of liquid materials.
Caution : Design engineers must design a product or process such that it is impossible to make a mistake at all. Example : Design features of parts that allow only correct assembly; unique connectors to avoid incorrect cable connections; symmetrical parts that avoid incorrect installation.
Make it easier : Using certain techniques and grouping steps makes the assembly process easier to complete. Example : Visual controls that include color coding, part markings. An intermediate box that visually controls that all parts are assembled. Applying characteristics to parts.
Detection : Errors are detected before they move to the next production process so that the operator can quickly correct the problem. Example : Sensors in a manufacturing process that detect that parts are not assembled correctly.
Mitigation : Trying to reduce the impact of errors. Example : Fuses to prevent circuit overloads resulting from short circuits.
The emphasis of quality control is shifting from checking finished products for the fact of defects to preventing the occurrence of defects at each stage of production.
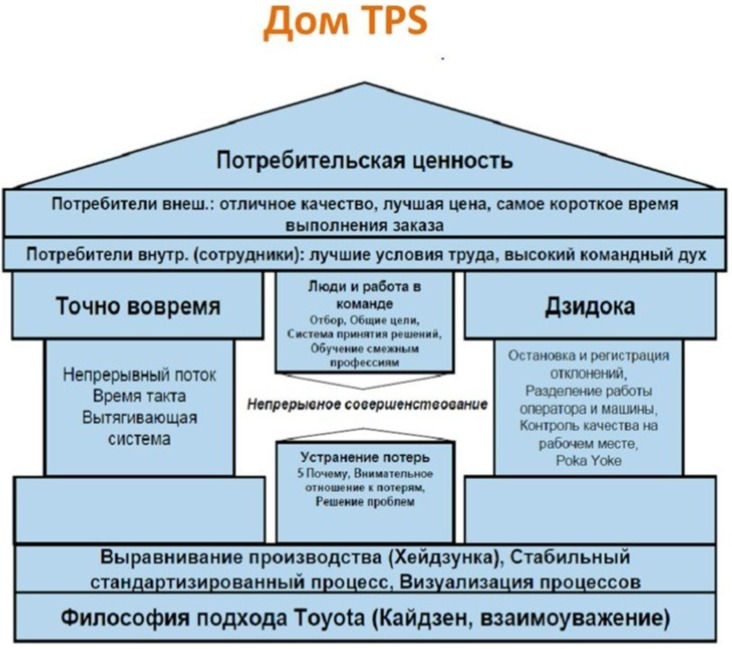
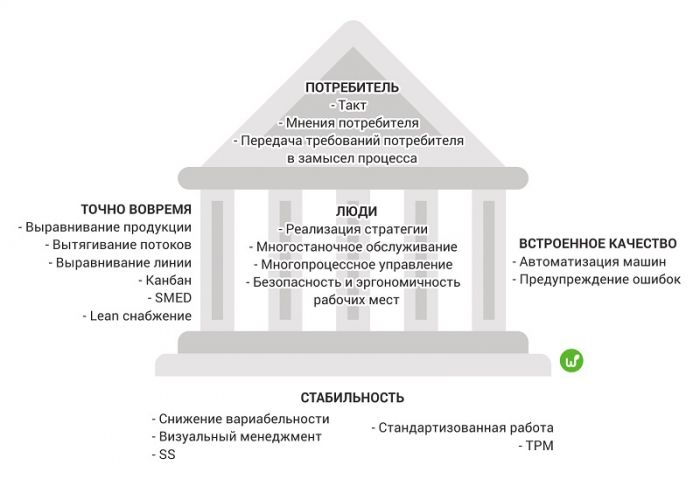
"House of TPS" was developed by Taichi Ohno and I. Toyoda specifically to make it easier to explain the Toyota Production System to employees and suppliers. According to the developers, the shape of the house (roof, columns and base) was used deliberately because it is understandable to everyone and symbolizes stability and solidity.
1st place - Inconsistency with Lean Manufacturing values
2nd place - Low priority for management
3rd place - Formalism (formal approach)
4th place - Following fashion
5th place - Problems of goal setting and vision of the future production system
6th place - Instrumental (technical) approach.
7th place - Lack of resources.
8th place - Disadvantages in organizing and managing the implementation of Lean Manufacturing
9th place - Poor basic conditions for employees
10th place - Lack of competencies
Pros of PSU

Disadvantages of Lean Manufacturing
Power/supply issues
Due to limited inventory in warehouses, lean manufacturing relies heavily on suppliers, who may supply products to the production process unreliably and intermittently. Issues such as employee illness, transportation delays, and supplier errors can be fatal. Sellers may be unable or even unwilling to supply parts or products on a tight schedule or in smaller quantities. Such requirements can place a burden on suppliers with overhead costs and create tensions that ultimately affect the production process and can lead to frequent changes in suppliers or even difficulty finding them.
High implementation costs
Implementing lean manufacturing often means completely dismantling previous physical plant setups and systems. Training employees can be lengthy, and managers gaining experience in Lean can add costs to companies. Purchasing equipment and setting it up can delay the implementation process. Small and medium-sized businesses, in particular, may find the cost of adopting lean manufacturing prohibitive.
Employee resistance
Lean requires an overhaul of production systems, which can cause stress and disengagement from employees who prefer the old ways of doing things. In addition, lean manufacturing requires the introduction of a permanent quality control employee. Older workers may prefer previous methods and may be resistant to group work. In this case, good managers are critical to the transition to lean manufacturing. This is also a certain difficulty - finding managers with sufficient leadership and skills in persuasion and working with resistance.
The problem of customer dissatisfaction
Because the manufacturing process is so dependent on the performance of suppliers, any disruption to the supply chain - and therefore production - can become an issue that negatively impacts customers. Delayed delivery can lead to long-term marketing problems that may be difficult to overcome.
6 Sigma is an American approach to production management, focused on solving problems and reducing the number of defects to a level of 3.4 units per 1 million units of finished products.
The concept was born at Motorola.

The essence of the concept comes down to the need to improve the quality of outputs of each process, minimize defects and statistical deviations in daily activities. The concept uses quality management methods, including statistical methods, requires the use of measurable goals and results, and also involves the creation of special working groups at the enterprise that carry out projects to eliminate problems and improve processes (“black belts”, “green belts”).
APPLICATION OF 6 SIGMA ALLOWS YOU TO IDENTIFY THE BOUNDARY OF THE CONTROLLED PROCESS. AND IF A PROBLEM IS IDENTIFIED, YOU WILL UNDERSTAND WHERE IS A SYSTEM PROBLEM AND WHERE IS A SPECIAL CASE. WHICH ALLOWS YOU NOT TO TREAT FORCE MAJEURE WITH EXCESSIVE MEASURES IN RELATION TO THE WHOLE SYSTEM. IT ALSO ALLOWS YOU TO IDENTIFY FAVORABLE EVENTS, ANALYZE THEM AND IMPLEMENT THEM TO IMPROVE THE PROCESS IN GENERAL.
Focus on the user
For example, take into account the target audience of the site and monitor the usability of the interface.
Make decisions based on data and facts
No guesswork. Everything must be backed up with numbers. To do this, you need to identify indicators that are important for the company and monitor them.
Process approach
See how the processes in the company interact. For example, testing each new website feature immediately after its creation is cheaper. And at the end of the project it’s more expensive. Plus, you may not be able to meet the deadlines.
Calculate moves
Consider possible outcomes and their consequences. For example, if there is only one level of deviation, additional testing time will be needed to improve it. This may not suit customers.
Collaboration within the team
Have a common goal and help each other achieve it.
To risk
Don't be afraid to fail for the opportunity to improve.
Sigma (σ) is a letter of the Greek alphabet. In mathematics, it denotes standard deviation, that is, when the data does not correspond to the average value.
The 3 sigma rule states: almost all values of a normally distributed random variable lie within the range of +- 3 sigma from the mean value. That is, with approximately a probability of 0.9973, the value of a normally distributed random variable lies in the specified interval.


6 Sigma calculation algorithm:
We add up all measured values and calculate the arithmetic mean value
We calculate the difference between the maximum and minimum values, for example for a month
We calculate the same difference for another, for example, 5 months
We calculate the arithmetic average of this difference over 6 months
In Shewhart's control charts we find the indicator d2, and take the value for the sample, in our example it is 6 months, which means d2 = 2.534
We take our average difference between the maximum and minimum and divide by d2
We get sigma
Now we set aside 3 sigma up and down from the average value from point 1. We get 6 sigma, which shows the boundaries of our controlled process. What is not inside is deviations. We find out the reasons and work with them

The Shewhart control chart is a visual tool used in production and business process management. A graph of changes in process parameters over time to implement statistical control of process stability.
Timely detection of instability allows for a controlled process, without which no improvements are possible in principle. Control charts were first introduced in 1924 by Walter Shewhart with the goal of reducing process variability by eliminating deviations caused by non-systemic causes.
When introducing control charts into an organization, it is important to identify priority issues and use the charts where they are most needed. Signals of problems can come from defect management systems, from customer complaints, from any organizational processes.
Control limits are a corridor within which the values lie in a stable state of the process. Control limits are calculated using formulas strictly tied to the type of map; these limits are calculated from process data and are in no way related to tolerances:
CL - central line (usually the average or median over a certain amount of data),
LCL - lower control limit,
UCL—upper control limit.

Signs of special variability indicate a violation of the stability (controllability) of the process:
points going beyond the upper or lower boundaries of the control chart,
7 or more points in a row lie on the same side of the midline,
more than 6 points monotonically increase or decrease.
There are other signs, but there is no established generally accepted set of additional rules for reading control charts, so it is recommended to use Shewhart’s rule first (points going beyond the boundaries), and introduce all the others as you gain experience, if necessary.
According to the measurement scale, maps are divided into qualitative and quantitative. Among the possible options for the sample parameter are maps of individual values, moving ranges , average, standard deviation , median, range .
DMAIC (an acronym for define , measure, analyze, improve, control ) is one of the main 6 Sigma tools. This is an approach to consistent problem solving and business process improvement
DMAIC, like most improvement methodologies, is based on the Deming cycle - PDCA
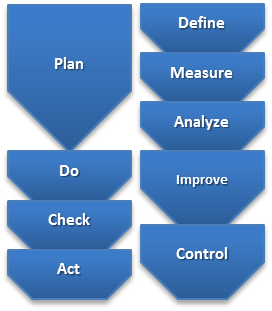
According to DMAIC, the solution to each process improvement or problem resolution task must sequentially go through all phases:
The first is restrictions. It is necessary to determine the customers, justification for the project, scope, goals and time boundaries of the project:
The second is measurements. The main metrics of the project, the reliability of the data source, and the current state of the process are determined.
The third is analysis. Research into process capabilities, causes of problems, possible risks.
The fourth is improvement. Modification of processes and systems, structural decomposition of work is carried out.
Fifth - control. Maintaining process changes, preparing reports and closing the project.
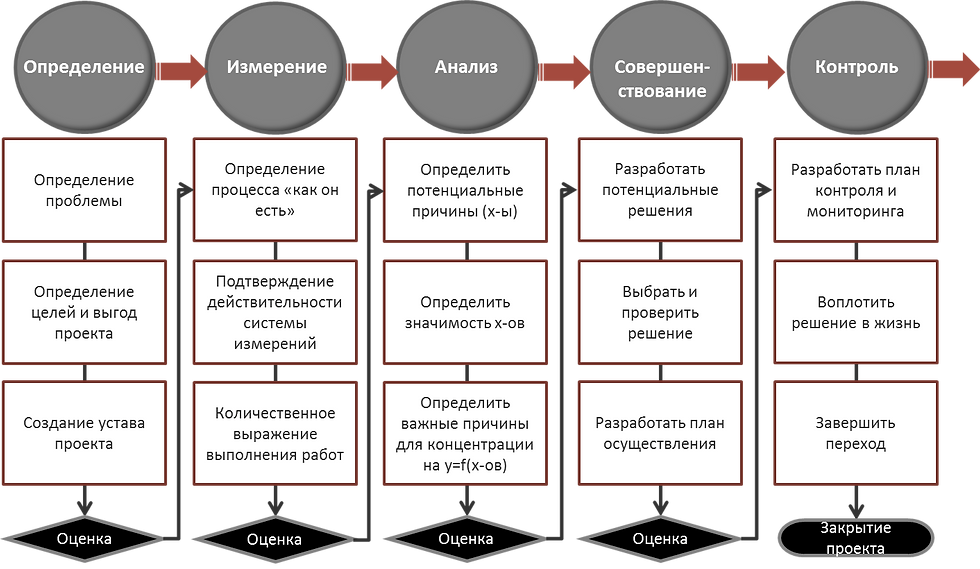
It is believed that this sequence provides a structured approach that allows you to move from identifying the essence of the problem to implementing solutions.

SIPOC ( supplier, input , process, output, customer ) is one of the tools for describing business processes. SIPOC allows you to trace the business logic of a process at a high but manageable level of abstraction.

SIPOC cards are used:
in 6 Sigma projects at the first stage of DMAIC - Define - in order to determine the “framework” of the project. With the help of SIPOC, the boundaries of the process under consideration are established before proceeding with its measurement (Measure) and analysis (Analyze).
in Lean projects ("Lean Manufacturing") at the stage of searching for losses in order to describe the movement of information/goods/services, as well as the relationships that arise between participants in the business process.
for the reorganization of business processes and their continuous improvement. Many problems in companies arise at the intersections of departments and positions. The “client-supplier” concept implemented in SIPOC is a good help here - one of the foundations of the process approach.

The essence of the SIPOC method is that we:
We pay special attention to the “scale” of the process.
We analyze the process, starting from the consumers of the final result of the process, ending with its initiator. Not the other way around!
We pay special attention to the “junctions” of the process stages.
We pay special attention to the readability of the process map
Start forming SIPOC “on the right” (C->O->P->I->S):
Identify customers.
Describe the products or services that customers require.
Provide a brief (5-7 key operations) description of the process.
Identify the main process inputs.
Provide a list of key suppliers
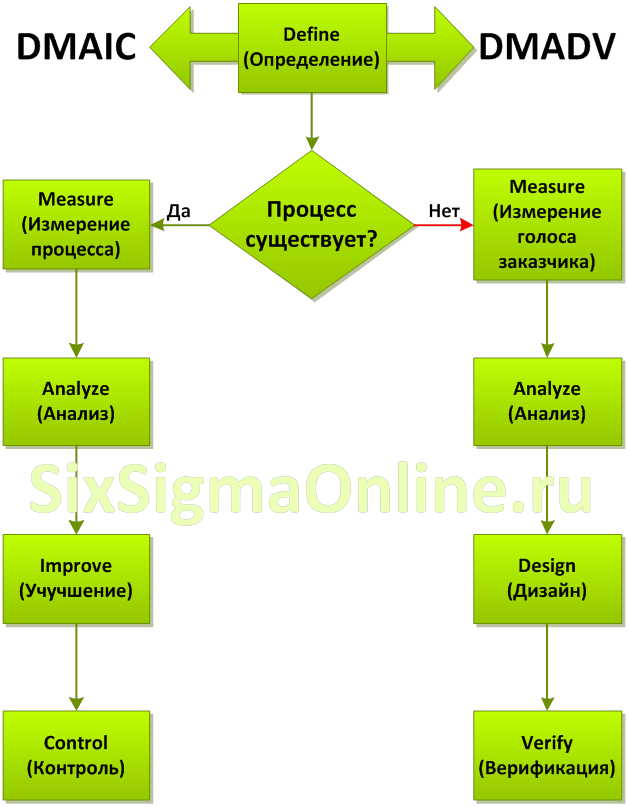
If the DMAIC cycle is used to work on existing processes, then to develop new processes, systems, products or services, 6 Sigma specialists most often use another cycle - DMADV:
Definition.
Measurement.
Analysis.
Design or development.
Verification.
DMADV can serve as the framework for a single project or as an organization's roadmap for design, development and innovation. At the same time, a significant part of the tools can be borrowed from the classic six sigma approach (DMAIC) and related methodologies (project management, reengineering, etc.).
The DMADV algorithm may also be referred to as DMADOV, where the extra "O" stands for "Optimize":
1. Define - Determine the goals of the project, similar to DMAIC.
2. Measure - Measure - Measure customer expectations. You also need to conduct comparative analysis and benchmarking (competitor analysis).
3. Analyze - Analysis - Search and analysis of alternative solutions
4. Design - Design - Carrying out detailed design
5. Optimize - Optimization - Using projects, business cases to optimize the solution
6. Verify - Verify the design through pilot tests before launching the product.
White Belts and Yellow Belts are company employees who know Six Sigma at an entry level and partially assist or participate in the project.
Beginners who have only theoretical knowledge receive White Belt status.
Green belts are employees who, in addition to their job responsibilities, work on implementing methodology and optimizing business processes. Black belts are watching this
Black belts are involved in the project and carry out the tasks assigned to them
Master Black Belts oversee the implementation of Six Sigma and command regular Black Belts
Champions implements the methodology in organizations and mentors Black Belts
Main guide. It distributes responsibilities and resources. Top management removes internal barriers and combats inherent employee resistance to change
Lean Six Sigma is a general system that includes both Japanese and American concepts, combining their most effective and efficient methods and tools:
Lean manufacturing (or Lean manufacturing) - actions aimed at reducing losses and speeding up processes.
6 Sigma (or Six Sigma) are activities whose purpose is to improve quality and increase customer satisfaction and loyalty.

Each of these concepts has advantages and disadvantages - so the Lean Six Sigma system combines them and includes all the advantages of both concepts and makes up for the shortcomings of each (what is missing in one concept is in the second). To make it easier to see this visually, look at the table of comparative analysis of these concepts.


The practice of using the Lean Six Sigma concept in Western enterprises allows one to achieve the following results on their own in a short time (about a year):
reducing the cost of products and services by 30-60%;
reduction in service provision time by up to 50%;
reduction in the number of defective products by approximately 2 times;
increase without additional costs the volume of work performed up to 20%;
reduction in the cost of design work by 30-40%;
reduction in project completion time by up to 70%.
Links:
Video:
Lean manufacturing and 6 sigma are not the only systems in management. It goes well with systems constraint theory , project management , digital transformation , etc.

Well, for the most patient - a description of the Rosatom production system as an example of the use of lean manufacturing tools


